Cloud-Native Observability and Security Analytics with SysFlow and Falco
Hello, fellow Falcoers! This blog introduces you to a new open system telemetry format and project called SysFlow. The project has deep ties to Falco, the de facto CNCF cloud-native runtime security project.
Falco is exceptional at detecting unexpected application behavior and alerting on threats at runtime. Furthermore, its components and architecture open itself to creative uses.
For example, SysFlow embeds Falco's rich observability libraries into its cloud-native security telemetry stack and Falco's rules language to achieve data abstraction, behavioral analytics, and noise reduction.
The Falco project and the community helped make the SysFlow project a reality and we are excited to guide you through a deep dive today! Also, learn about how we integrated our solution with Falcosidekick to help diagnose alerts.
What is SysFlow?
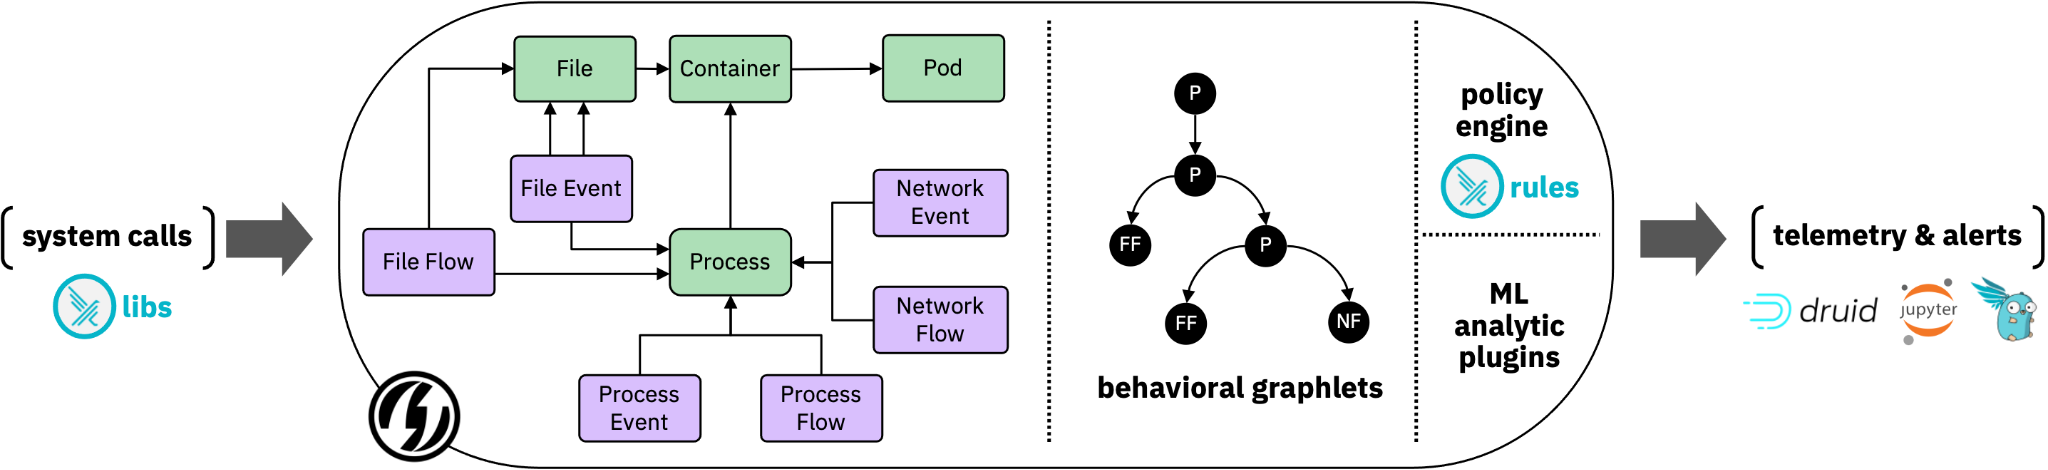
SysFlow is a compact open telemetry format that records workload behaviors by connecting event and flow representations of process control flows, file interactions, and network communications. The resulting abstraction encodes a graph structure that enables provenance reasoning on host and container environments, and fast retrieval of security-relevant information.
What challenges does it solve?
The following are the key reasons that set SysFlow apart:
- Reduces data footprints drastically when compared to raw system call collection.
- Reduces event fatigue (a.k.a. "too many alerts") thanks to its underlying entity-relational model and flow abstractions.
- Minimizes the requirements for hard filters.
- Provides useful context by linking together system event data at the data format level. This expedites security analysis, enabling analytics beyond simple manual policies, including machine learning, stateful analytics, and automated policy generation.
- Treats system security monitoring as a data science problem through rapid edge analytics building, easy-to-use APIs, and support for multiple data serialization and export formats.
Built on Falco libs
The SysFlow format is supported by an edge processing pipeline that aggregates event provenance information and supports real-time enrichment of the telemetry stream with attack TTP labels, environment metadata, and Kubernetes log data.
As a benefit of using the Sysflow format, users go from managing individual events generated from different sources to obtaining an enhanced dataset to work with, enabling them to focus on writing and sharing analytics on a scalable, common open source platform.
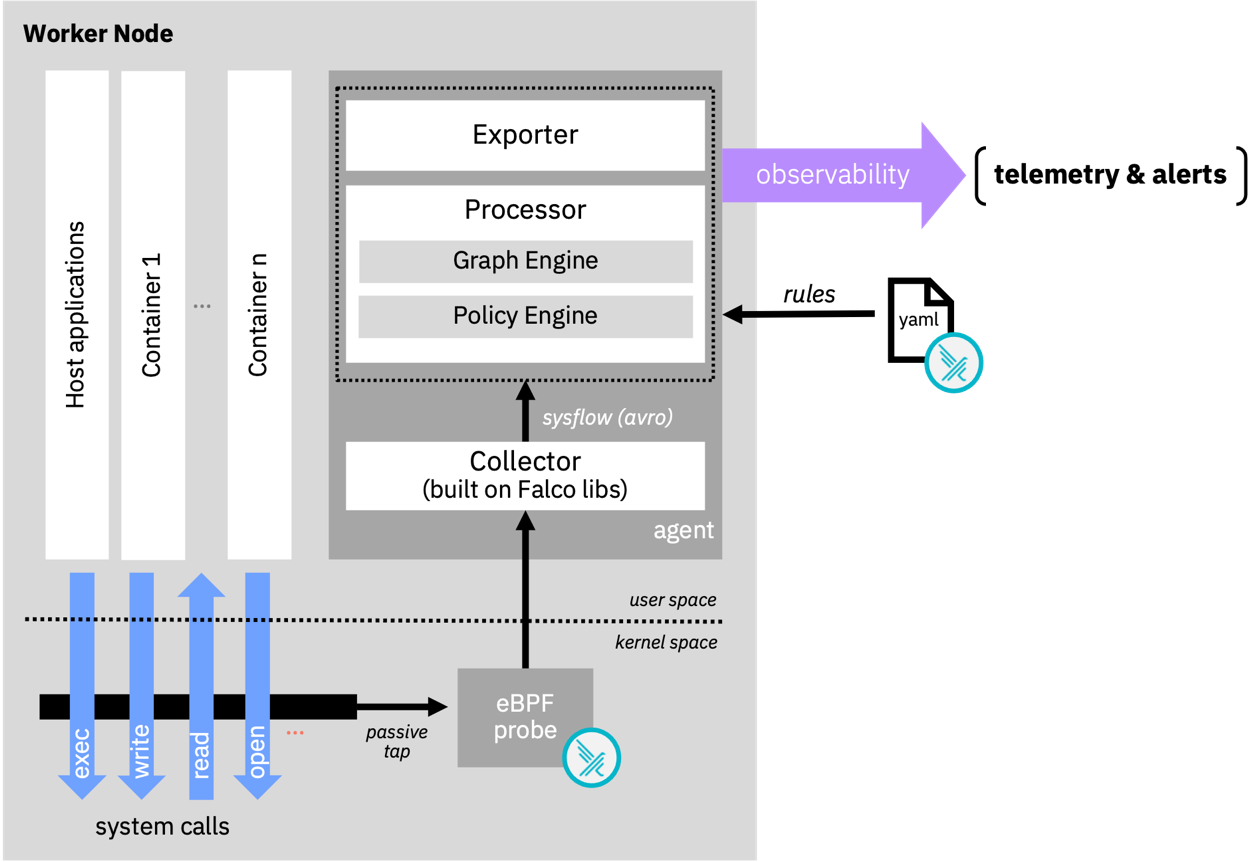
The framework builds on Falco libs and the Falco rules language to create the plumbing required for system telemetry as shown in the diagram below.
Falco libs facilitate the collection of system events generated from the host and containers through the eBPF probe in the kernel space.
At user level, the SysFlow Collector, also leveraging Falco libs, collects the previous events and exports the captured information using Apache Avro object serialization.
The SysFlow Processor processes and enriches the data. The policy engine applies logical rules to filter, alert or semantically label sysflow records using a declarative language based on Falco rules.
The SysFlow framework is designed as a pluggable edge processing architecture, which includes a policy engine, and what's more noteworthy, an experimental graph engine.
The policy engine accepts declarative policies (written in Falco rules syntax) and supports edge filtering, tagging, and alerting on SysFlow streams.
And a visual addition is the experimental graph engine, which clusters and exports concise behavioral profiles of monitored applications. We'll see an example in a moment.
Beyond the built-in plugins and exporters provided in the SysFlow stack, users can write and plug their own real-time analytics, and consume new telemetry sources using our Golang APIs. The framework also includes Python packages and a pre-built Jupyter container to facilitate interactive SysFlow data exploration.
Falco Sidekick integration
Falco Sidekick is a relatively young project but has already harnessed 3.7M pulls on Docker Hub!
At its core, it's a simple daemon for connecting Falco events to many different ecosystems, like a Swiss Army Knife of sorts. It also provides an intuitive web user interface for event visualization and filtering.
To demonstrate how SysFlow can extend Falco's capabilities, we have been working on an experimental integration with Falco Sidekick.
The complete ecosystem includes:
- The SysFlow telemetry stack with a new exporter encoder for Falco events.
- A searchable back store based on S3.
- Apache Druid, and new extensions to Falco Sidekick for visualizing and interactively querying SysFlow process graphlets.
The Falco Sidekick integration in action
To illustrate how all these components fit together, let's consider the following scenario:
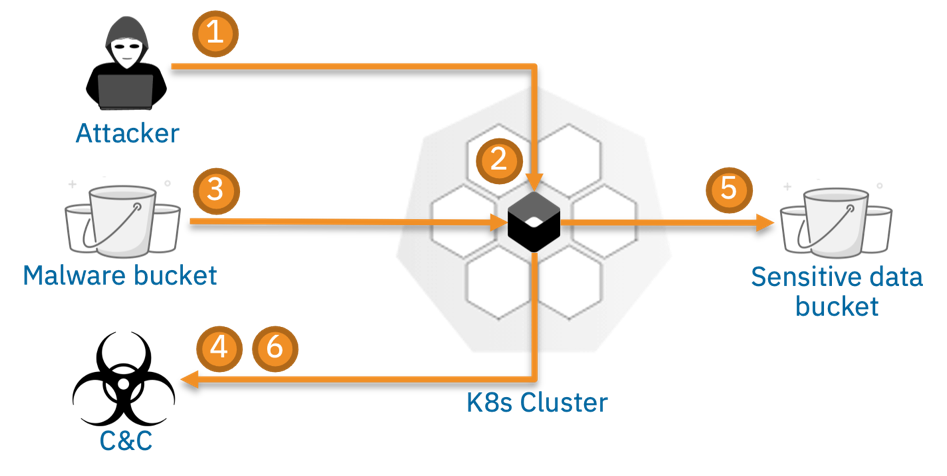
It shows an attack in which a cybercriminal exfiltrates data from a Kubernetes service.
- During reconnaissance, the attacker detects a vulnerable node.js service that is susceptible to a remote code execution attack exploiting a vulnerability in an node.js module.
- The attacker exploits the system using a malicious payload, which hijacks the node.js server.
- The attacker then downloads a python script from a remote server.
- The script contacts its command-and-control server), and then starts scanning the system for sensitive keys.
- The attacker eventually gains access to a sensitive customer database.
- The attack completes when data is exfiltrated off site.
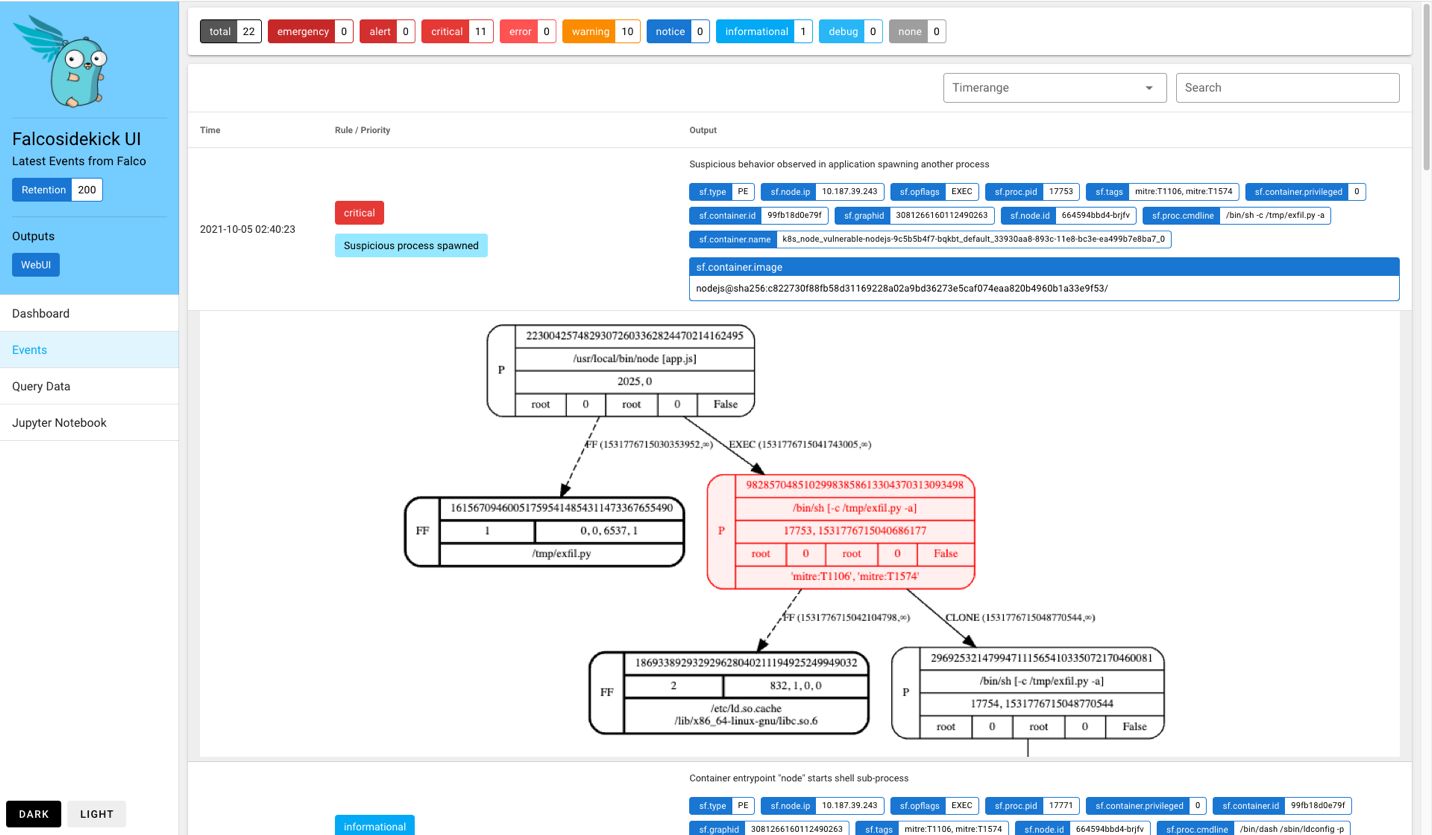
In this setup, the SysFlow monitors the Kubernetes cluster and outputs alerts to Falco Sidekick, which are annotated with an ID ("sf.graphid") referencing compact behavioral graphs labeled with MITRE ATT&CK metadata that can help diagnose alerts.
As a proof-of-concept, we customized Falco Sidekick's web interface to fetch and display the graph associated with an event. For example, the screenshot below shows the precise infection point in which the benign node.js application has been hijacked into spawning an attack script.
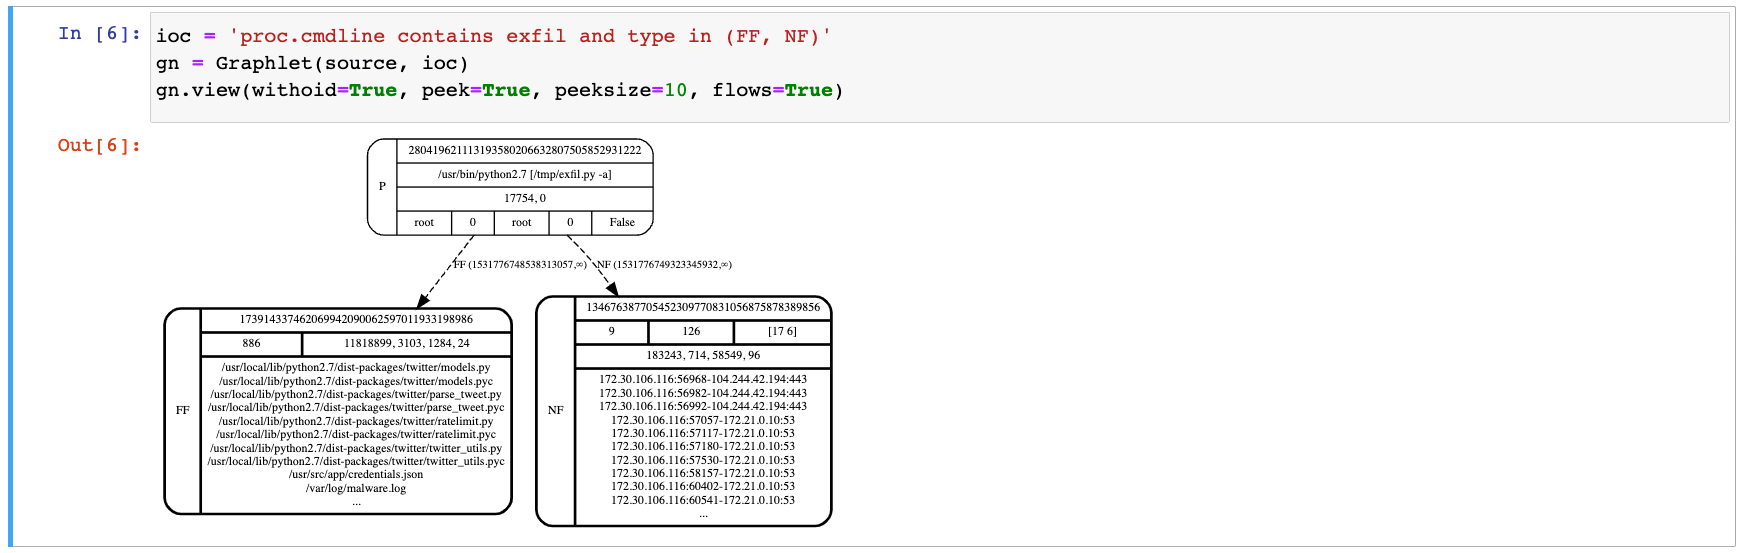
Based on this alert, we can further investigate the potential threat using our interactive Jupyter environment. Typically, the first step in this diagnosis routine is to craft a hypothesis, or indicator, based on the original event. The syntax follows the rules condition language used in the SysFlow policy engine. A reasonable hypothesis would be to query for network and filesystem activity associated with processes containing the string "exfil" in its command line.
Applying this indicator fetches a new graph from the storage backend that shows that the attack script was executed and has been busy interacting with the filesystem and communicating over the network.
Suspicious, huh?
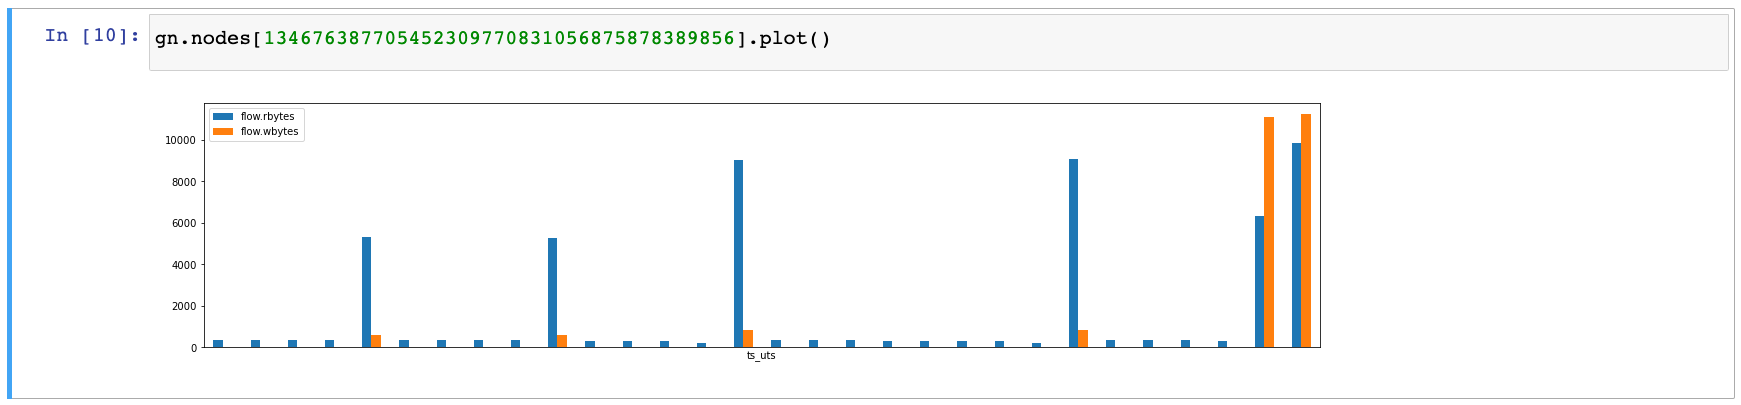
Since data exfiltration is of immediate concern, we can use the SysFlow APIs to quickly glance over the ingress and egress traffic associated with this process. We immediately recognize a periodic pattern in the network flows, which is indicative of command-and-control behavior, such as beaconing. We also see a suspiciously high outbound traffic at the end of the communication, which surely deserves further attention.
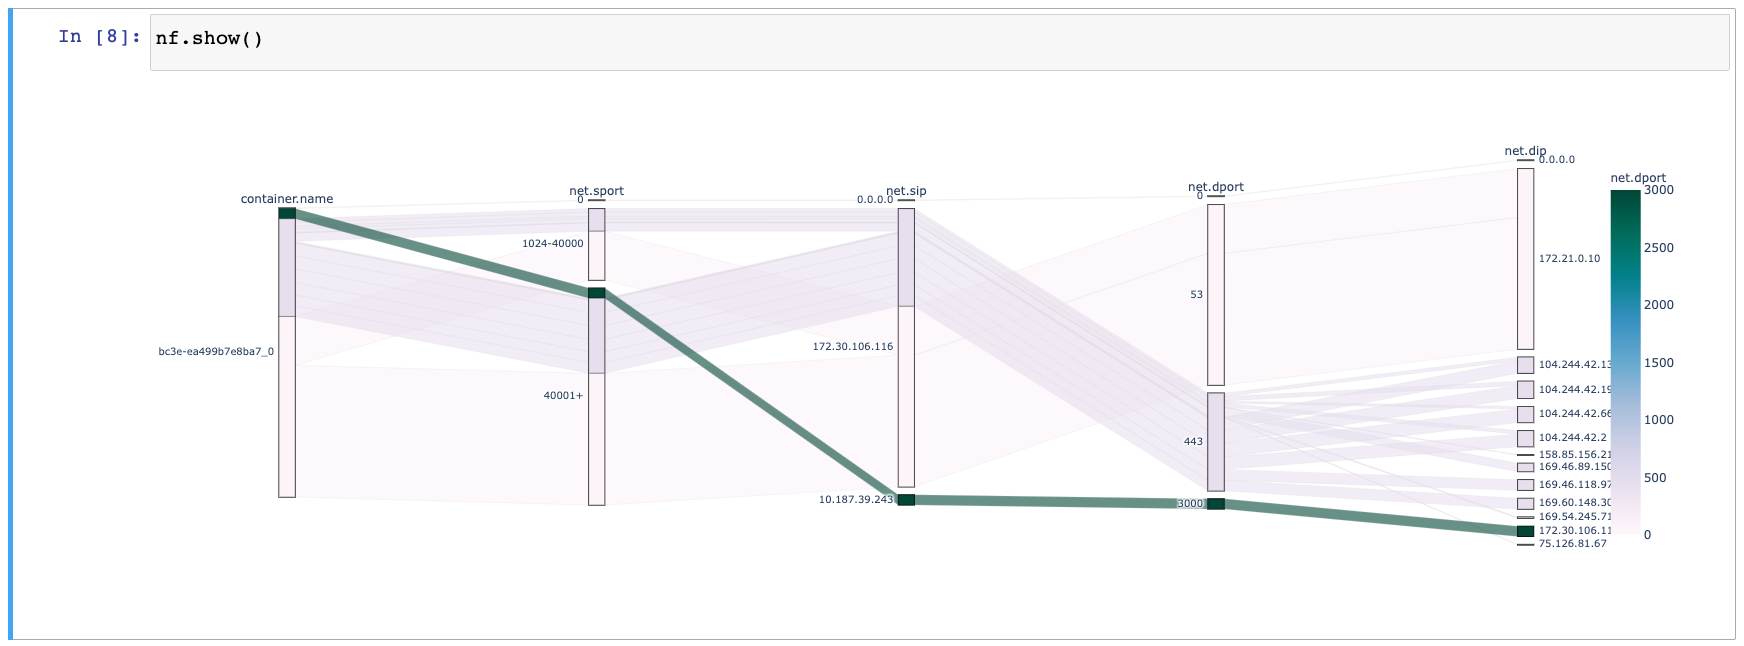
We close our investigation by projecting the SysFlow trace associated with the above graph across different components, including container and network primitives. Two types of flows are of particular interest to us here: the backend flow from 172.30.106.11:3000 (internal object storage endpoint) that connects to the egress flow 104.244.42.*:443 (external exfiltration endpoint) through container bc3e.
Conclusion
This integration is still experimental, but we are excited about the possibilities it holds and reminds us how well the Falco architecture makes it possible to use it in a creative way that is SysFlow. The goal is to refine this proof-of-concept to inform our future contributions to Falco. For example, a natural next step is to work on a SysFlow library and plugin for the incubating libs plugin system.
Where to learn more
If you would like to learn more about SysFlow:
- Get started in sysflow.io
- Check our past research papers and presentations.
- Check out the SysFlow organization in github.
- Meet us on the SysFlow Slack (we are also active on the Falco Slack channel!).
You can learn more about Falco as well:
- Get started in Falco.org
- Check out the Falco project in GitHub
- Get involved with the Falco community
- Meet the maintainers on the Falco Slack
- Follow @falco_org on Twitter
We look forward to your feedback and contributions! PRs are welcome!
