Introducing Falco Talon v0.1.0
More than 7 years ago, frustrated by the lack of integrations between Falco and third parties, I created Falcosidekick. The tool evolved much more than expected, with the help of dozens of contributors, individuals or for companies, to have now almost 70 different integrations, and more are coming. Its baby brother came few years later, Falcosidekick UI, helping people to visualize in real time the alerts leveraged by Falco and fine tuning their rules.
A frustation remained after all. With Falco, we have an amazing tool to detect suspicious events in our Linux hosts, VM and Kubernetes clusters, with Falcosidekick, we can easily notify our Dev/Secops, index the alerts in some SIEM, etc. But a last piece was missing: how to react to these events?
With the integrations of well known FaaS in Falcosidekick, we started a series of blog posts to show how to create from scratch what we call a "response engine". All these systems are modular, flexible, robust, but they all require a considerable amount of work from the user, to deal with the Falco payload format, the errors, the retries, the authentication to the API (AWS, Kubernetes Control Plane), the logs, the metrics, etc. Not all users and companies have the skills and/or the budget to maintain such an architecture.
To answer these needs, we designed and created Falco Talon. The the first version is officially out!.
What is Falco Talon?
Falco Talon is a Response Engine for managing threats in Kubernetes clusters. It enhances the solutions proposed by the Falco community with a no-code tailor-made solution. With easy rules, you can react to events from Falco in milliseconds.
Why did we created Falco Talon?
Over the years, the Falco community proposed different methods to react to the Falco Events, what we call a response engine.
All these methods rely on a 3rd party FaaS (Function as a Service) and come with drawbacks, all actions must be developped by the users to manage:
- The errors
- The Falco event format
- The authentication
- The K8s SDK complexity
- The security
- The upgrades of the dependencies
- Latency
- Complexity to manage sequential actions
- Intrication between the function and the configuration
This is why we started to develop a custom solution specifically built for Falco: Falco Talon:
- Tailor made for the Falco events
- Easy to define rules
- No-code implementation for end-users
- UX close to Falco with the rules (yaml files with append, override mechanisms)
- Allow to set up sequential actions to run
- Structured logs (with a trace id)
- OTEL/Prometheus Metrics and OTEL Traces
What is it good for?
- React in real-time to the Falco Events
- Allow fine granularity to match the events to react to
- Responding to default rules with specific overrides
What is it not (yet?) good for?
- Complex reaction worflows with conditions between the steps
- Run actions at the host/node level through SSH (like Ansible does)
Docs
A dedicated website has been created to host the documentation: https://docs.falco-talon.org.
How Falco Talon works
As the same manner Falcosidekick works, Falco Talon receives the events from Falco by http. All you have to do to connect Falco and Falco Talon is to set in your falco.yaml:
jsonOutput: true
jsonIncludeOutputProperty: true
httpOutput:
  enabled: true
  url: "http://<falco-talon>:2803/"
If you already use Falcosidekick to forward your Falco events to the world, an integration is available since Falcosidekick 2.29.0:
talon:
  address: "http://<falco-talon>:2803/"
  checkcert: false
When the events are received by Falco Talon, an internal queue system based on NATS Jetstream is in charge to deduplicate them, to avoid to trigger the same action for the same cause for nothing.
Falco Talon will then compare the event with the rules created by the user, if an event matches with a rule, a series of actions are sequentially performed. At the end of each step, a notification with the status is sent, and a log is emmited.
Rules
The rules are the "core" of Falco Talon as they describe which actions to trigger for which Falco event.
All rules are written as yaml file, evaluated in the order they are given to Falco Talon (as arguments or in the config file), with rules specified later in the file overriding the previous ones.
The rules are composed of 2 blocks:
- the
actionblock defines which actionner to use with its parameters, this block can be imported by multiple rules (like themacroscan be used in the Falco rules) - the
ruleblock defines the criterias to match to trigger the actions
The criterias to match the event with the actions can use all elements that compose a Falco event JSON payload:
- the Falco rule name
- the
priority - the
tags - the
output fields
Examples
When Falco Talon receives an event triggered by the Falco rule named Terminal shell in container, and this event doesn't concern the kubernetes namespaces kube-system and falco, then the related pod is labeled suspicious: true
- action: Label Pod as Suspicious
  description: "Add the label suspicious=true"
  actionner: "kubernetes:label"
  parameters:
    labels:
      suspicious: "true"

- rule: Terminal shell in container
  description: >
    Label the pod outside kube-system and falco namespaces if a shell is started inside
  match:
    rules:
      - Terminal shell in container
    output_fields:
      - k8s.ns.name!=kube-system, k8s.ns.name!=falco
  actions:
    - action: Label Pod as Suspicious
The action block are useful but not mandatory, the same result can be done by specifying the action in the rule block directly:
- rule: Terminal shell in container
  match:
    rules:
      - Terminal shell in container
    output_fields:
      - k8s.ns.name!=kube-system, k8s.ns.name!=falco
  actions:
    - action: Label Pod as Suspicious
      actionner: "kubernetes:label"
      parameters:
      labels:
        suspicious: "true"
Actionners
The actionners are on-catalog actions you can use. You just have to specify which one you want use to use, its parameters, and Falco Talon will manage for you all the complexity. This is how we created a no code response engine.
Within this first version, we tried to integrate as much useful actionners as possible, which allow you to manage a large variety of situations and reactions in Kubernetes.
The available actionners are:
kubernetes:terminatekubernetes:labelkubernetes:networkpolicykubernetes:execkubernetes:scriptkubernetes:logkubernetes:deletekubernetes:drainkubernetes:downloadkubernetes:tcpdumpaws:lambdacalico:networkpolicycilium:networkpolicy
To know more about what the actionners do, what parameters they require, you can read on docs/actionners.
You can notice all actionners names are composed of 2 elements x:y, the first element is the category of the actionner. All actionners in the same category share the same client, it avoid to have multi inits and instances.
Outputs
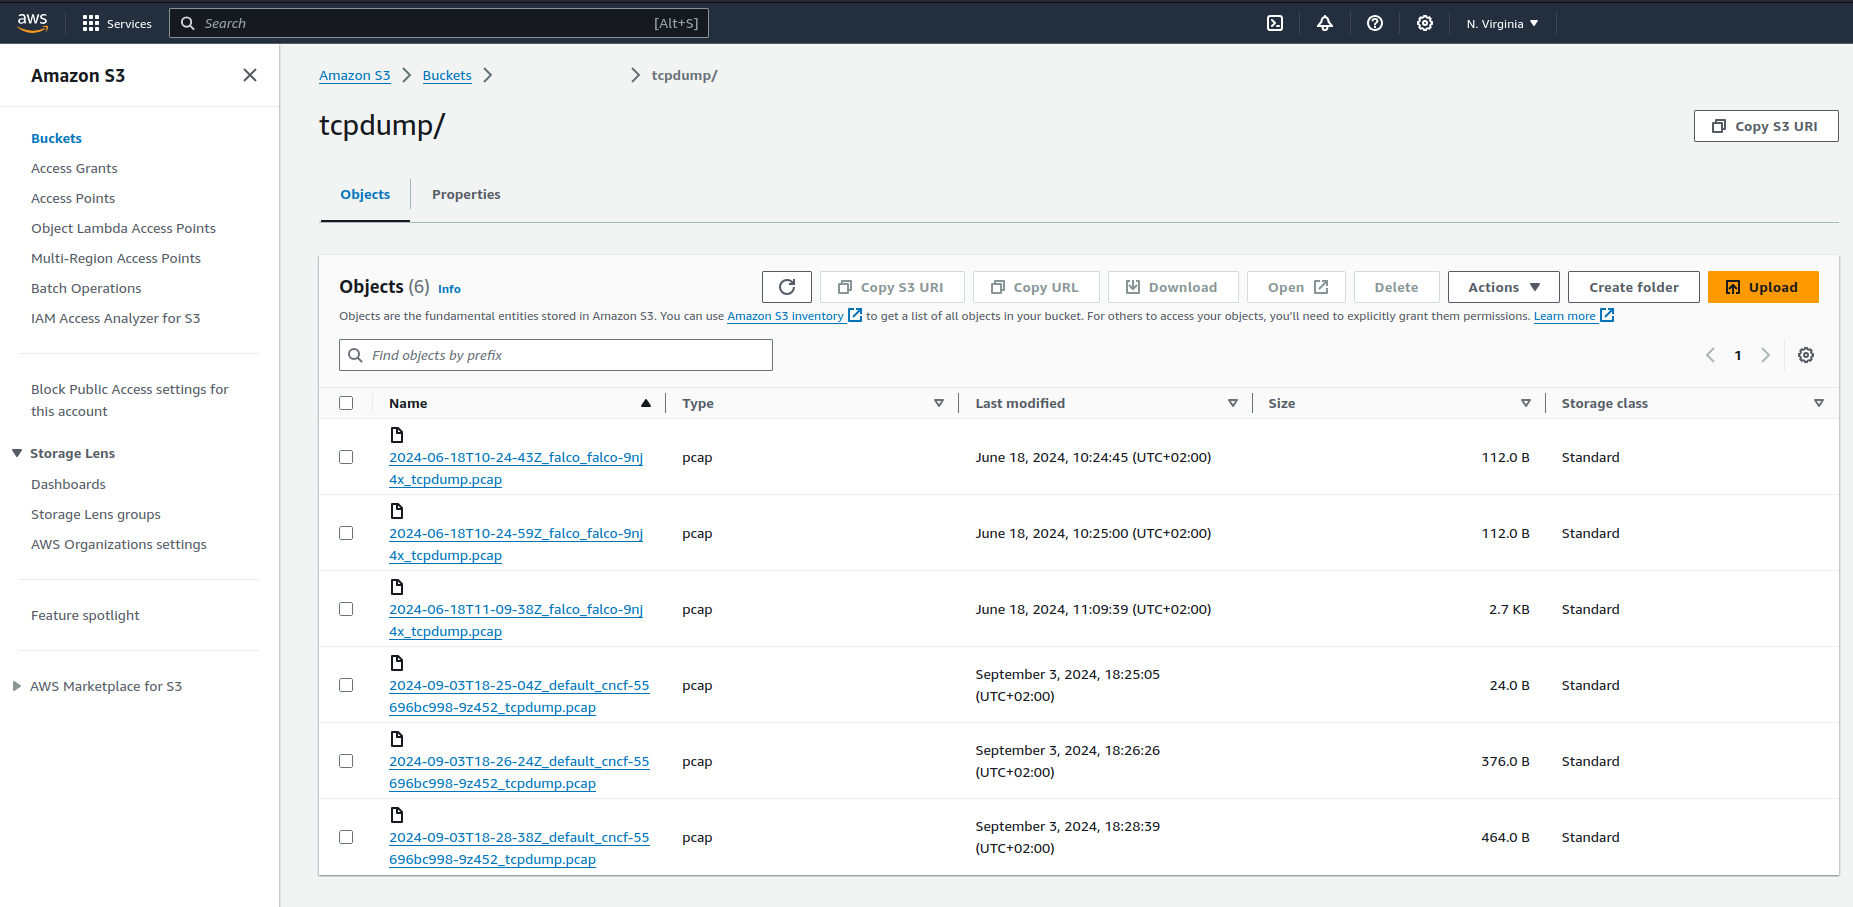
Some actionners require an output, an output is a target for the artifact created by the actionner, for example for the file retrieved by kubernetes:download or the .pcap created by kubernetes:tcpdump.
3 outputs are available today:
local:file(only useful for local tests)aws:s3minio:s3
The list of the available outputs can be found on docs/outputs.
Example
- rule: Redirect STDOUT/STDIN to Network Connection in Container
  match:
    rules:
      - Redirect STDOUT/STDIN to Network Connection in Container
  actions:
    - action: Run tcpdump for 5s
      actionner: "kubernetes:tcpdump"
      parameters:
        snaplen: 512
        duration: 5
      output:
        target: "aws:s3"
        parameters:
          bucket: <my-bucket>
          prefix: /tcpdump/
          region: us-east-1

Notifiers
Even we're talking about a "response engine", a framework to automatically react to some events, we still want (we humans), to be noticed of what's happening or keep traces of the performed actions.
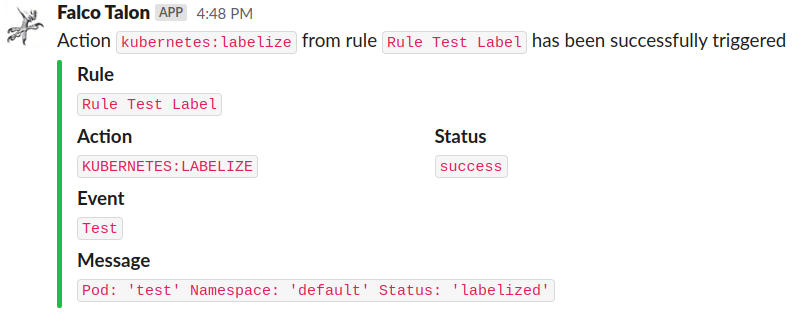
Apart from logs output to stdout, some notifiers can be used to forward action results:
elasticsearchk8seventslokislacksmtpwebhook
The list of the available notifiers can be found on docs/notifiers.
Examples
k8sevents:
action: kubernetes:tcpdumpthought,
apiVersion: v1
eventTime: "2024-09-05T12:52:10.819462Z"
firstTimestamp: null
involvedObject:
  kind: Pod
  namespace: default
kind: Event
lastTimestamp: null
message: |
  Status: success
  Message: action
  Rule: Redirect STDOUT/STDIN to Network Connection in Container
  Action: Run tcpdump for 5s
  Actionner: kubernetes:tcpdump
  Event: Redirect STDOUT/STDIN to Network Connection in Container
  Namespace: default
  Pod: cncf-55696bc998-5xjcb
  Output: a tcpdump "tcpdump.pcap" has been created
  TraceID: c954bd8b3391a08f23079552fdd639f3
metadata:
  creationTimestamp: "2024-09-05T12:52:10Z"
  generateName: falco-talon-
  name: falco-talon-zgxfm
  namespace: default
  resourceVersion: "115862544"
  uid: 3b4bd17f-ed1a-4693-bfd7-d10f674a8008
reason: falco-talon:action:kubernetes:tcpdump:success
reportingComponent: falcosecurity.org/falco-talon
reportingInstance: falco-talon
source:
  component: falco-talon
type: Normal
slack:

A tool designed for the production
I spent 10 years of my career as a DevOps/SRE, managing traditional and cloud infrastructures, I know how painful it is to manage systems not well designed for the runtime. This is why we tried from the beginning to create a tool easy to rule all along it lifecycle.
A CLI to validate the rules
As it is for the Falco rules, the best way to manage the lifecycle of the rules for Falco Talon is to follow the GitOps principles. This requires to set up a validation of their syntax as step in the CI.
The Falco Talon binary can also be used as a CLI, allowing to perfom tasks on the rules, like checking their validity or printing their results after the merges/overrides of several files:
$ falco-talon rules check --help

Check Falco Talon Rules file

Usage:
  falco-talon rules check [flags]

Flags:
  -h, --help   help for check

Global Flags:
  -c, --config string       Falco Talon Config File (default "/etc/falco-talon/config.yaml")
  -r, --rules stringArray   Falco Talon Rules File (default [/etc/falco-talon/rules.yaml])
Examples
With a valid rules file:
$ falco-talon rules check -c ./config.yaml -r ./rules.yaml

2024-09-05T16:42:28+02:00 INF rules result="rules file valid"
With an invalid rules file:
$ falco-talon rules check -c ./config.yaml -r ./rules.yaml

2024-09-05T16:44:01+02:00 ERR rules error="unknown actionner" action="Label Pod as Suspicious" actionner=foor:bar rule="Terminal shell in container"
2024-09-05T16:44:01+02:00 FTL rules error="invalid rules"
exit status 1
Structured Logs
The logs, whatever the component emitting them, keep always the same structure and contain a trace_id field, allowing to follow the workflow performed by Falco Talon.
The value of trace_id is also used to create the TraceId the OTEL Traces, by using a log backend like Loki, it becomes easy to correlate the traces with the logs in the same UI, like Grafana.
The CLI contains more features, take a look at them on docs /installation_usage/usage.
Example
Each step is clearly identified by the tag after the log level:
2024-09-05T14:52:03+02:00 INF event event="Redirect STDOUT/STDIN to Network Connection in Container" output=<truncated> priority=Critical source=syscall trace_id=c954bd8b3391a08f23079552fdd639f3

2024-09-05T14:52:03+02:00 INF match event="Redirect STDOUT/STDIN to Network Connection in Container" output=<truncated> priority=Critical rule="Reverse shell detected" source=syscall trace_id=c954bd8b3391a08f23079552fdd639f3

2024-09-05T14:52:10+02:00 INF action action="Run tcpdump for 5s" actionner=kubernetes:tcpdump event=test namespace=default output="a tcpdump 'tcpdump.pcap' has been created" pod=cncf-55696bc998-5xjcb rule="Reverse shell detected" status=success trace_id=c954bd8b3391a08f23079552fdd639f3

2024-09-05T14:52:10+02:00 INF notification action="Run tcpdump for 5s" actionner=kubernetes:tcpdump notifier=k8sevents rule="Reverse shell detected" stage=action status=success trace_id=c954bd8b3391a08f23079552fdd639f3

2024-09-05T14:52:11+02:00 INF output action="Run tcpdump for 5s" bucket=xxxxx category=aws file=tcpdump.pcap key=2024-09-05T14-52-10Z_default_cncf-55696bc998-5xjcb_tcpdump.pcap output="the file 'tcpdump.pcap' has been uploaded as the key 'tcpdump/2024-09-05T14-52-10Z_default_cncf-55696bc998-5xjcb_tcpdump.pcap' to the bucket 'xxxxx'" output_target=aws:s3 prefix=tcpdump/ region=us-east-1 status=success trace_id=c954bd8b3391a08f23079552fdd639f3

2024-09-05T14:52:11+02:00 INF notification action="Run tcpdump for 5s" actionner=kubernetes:tcpdump notifier=k8sevents output_target=aws:s3 rule="Reverse shell detected" stage=output status=success trace_id=c954bd8b3391a08f23079552fdd639f3
Metrics
Falco Talon exposes the traditional /metrics endpoint with metrics in the Prometheus format.
To keep a consistency, all metrics related to Falco Talon itself are prefixed with falcosecurity_falco_talon_, it follows the same convention used by Falco for its metrics.
For people interested by the metrics in the OTEL format, it's also available, see docs installation_usage/metrics
Example
# HELP action_total number of actions
# TYPE action_total counter
falcosecurity_falco_talon_action_total{action="Disable outbound connections",actionner="kubernetes:networkpolicy",event="Test logs",namespace="falco",otel_scope_name="github.com/Falco-Talon/falco-talon",otel_scope_version="devel",pod="falco-5b7kc",rule="Suspicious outbound connection",status="failure"} 6
falcosecurity_falco_talon_action_total{action="Terminate Pod",actionner="kubernetes:terminate",event="Test logs",namespace="falco",otel_scope_name="github.com/Falco-Talon/falco-talon",otel_scope_version="devel",pod="falco-5b7kc",rule="Suspicious outbound connection",status="failure"} 6
# HELP event_total number of received events
# TYPE event_total counter
falcosecurity_falco_talon_event_total{event="Unexpected outbound connection destination",otel_scope_name="github.com/Falco-Talon/falco-talon",otel_scope_version="devel",priority="Critical",source="syscalls"} 2
# HELP match_total number of matched events
# TYPE match_total counter
falcosecurity_falco_talon_match_total{event="Unexpected outbound connection destination",otel_scope_name="github.com/Falco-Talon/falco-talon",otel_scope_version="devel",priority="Critical",rule="Suspicious outbound connection",source="syscalls"} 2
OTEL Traces
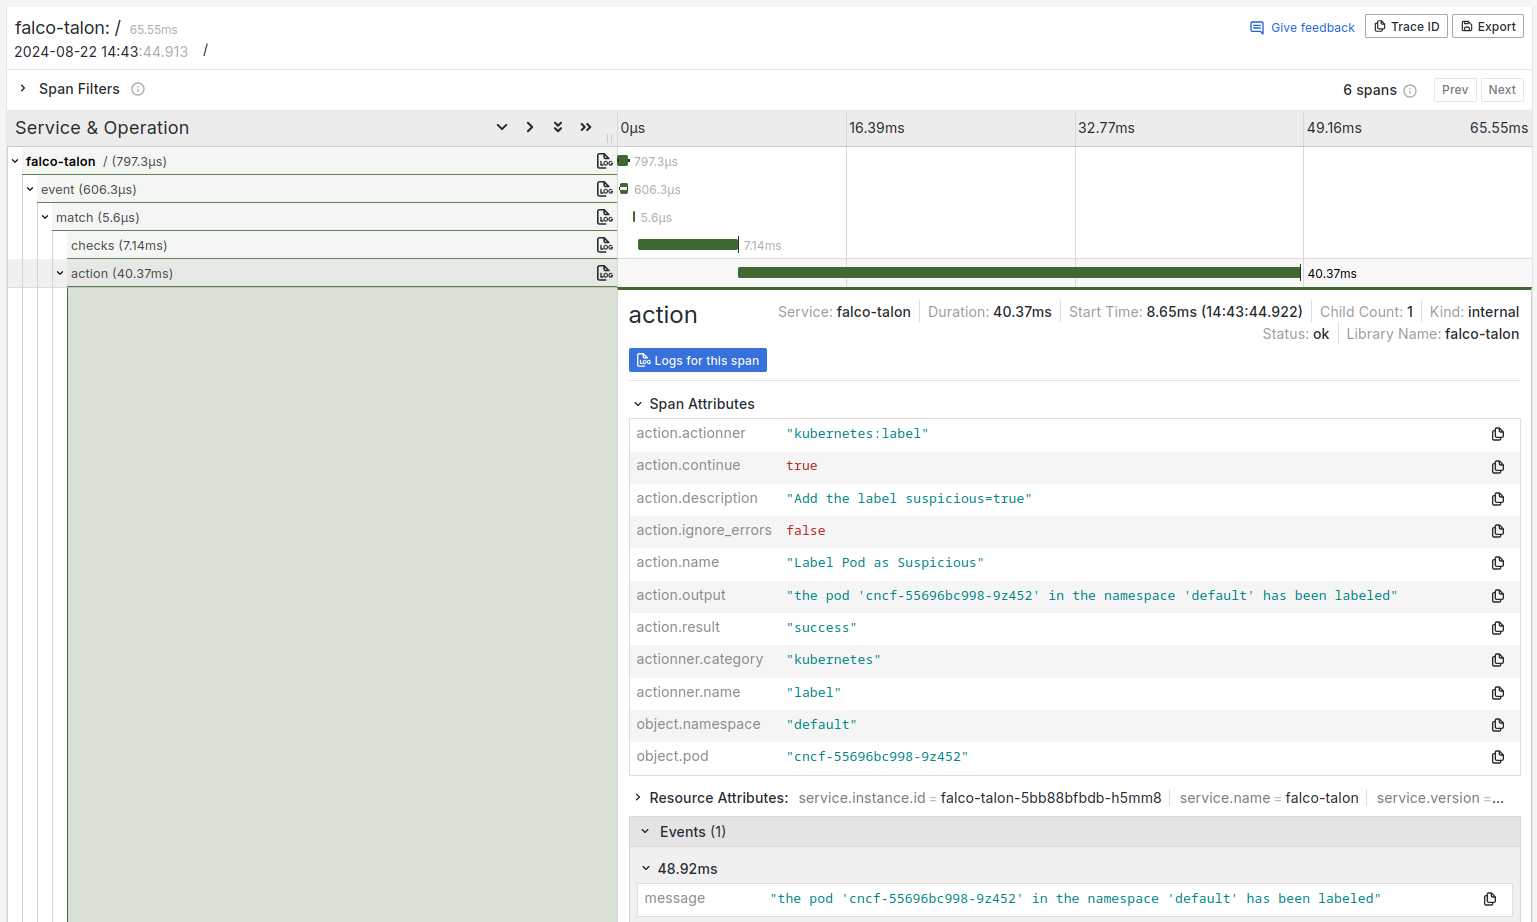
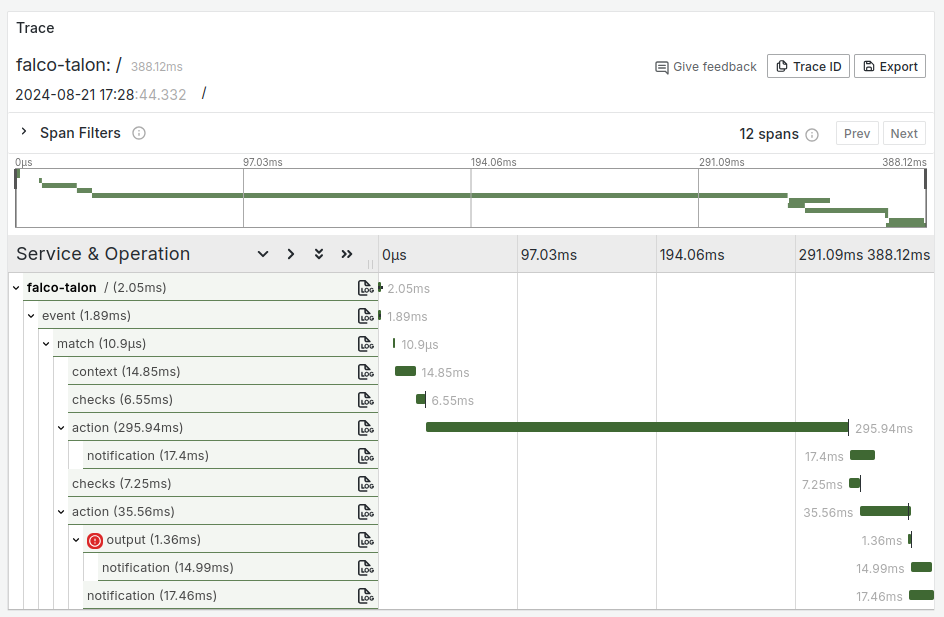
We know following logs can be not really convenient, and they may lack of useful informations. You can therefore enable the emits of Traces in the OTEL format. All backends accepting this format can be used to store and visualize them.
To know how to set up the traces, see docs installation_usage/traces.
Examples
In Grafana with Tempo:


In Jaeger:

Installation
The easiest way, for now, to deploy Falco Talon is to use the Helm chart included in the repo.
with Helm
Since version 0.2.0, chart has been moved under the official falcosecurity/charts repository
The procedure to install the v0.1.0 of Falco Talon is:
helm repo add falcosecurity https://falcosecurity.github.io/charts
helm repo update falcosecurity
helm upgrade --install falco-talon falcosecurity/falco-talon
Shoutout
I would like to shoutout some persons without the project would have been possible:
- Dan Papandrea who thought about the first specs of the project with me and found the name
Falco Talon - Igor Eulalio who develops
Falco Talonwith me, introduced amazing features like the traces, and injected so much energy in the project - Rachid Zarouali, the tester #1, a lot of features came from his ideas and feedbacks, he's also always a pleasure to present a talk about
Falco Talonwith him - Nigel Douglas who tests and promotes
Falco Talonwith talks and blog posts since the alpha stages - Carlos Tadeu Panato Júnior the magician of the CI, who still continue to manage the upgrade of the dependencies
What's next?
This first release, the v0.1.0, is just GA and it's the beginning of the journey. All your feebacks and ideas are welcome, this project has for DNA to improve the security of the Kubernetes clusters by answering real needs and usages.
The next big step to achieve is to join officially the falcosecurity organization. An issue has been created in the evolution repo to do so. Don't hesitate to vote for 🙏!
Thomas
To go further:
- GitHub repo of the
Falco Talonproject: https://github.com/falco-talon/falco-talon - Official docs of
Falco Talon: https://docs.falco-talon.org/ - A record of a talk (by Rachid and Thomas) in French to introduce
Falco Talon: https://www.youtube.com/watch?v=Mx28fhyKX7Q
