Falco Security and Monitoring on RKE Bare Metal Cluster with Rancher
Foreword
This article is, like my previous article about OpenEBS and NFS Server Provisioner, a hands-on guide on how to install, configure and monitor your existing cluster with Falco.
Background
Kubernetes is a great technology and brings many possibilities but also more complexity. To get more involved with Kubernetes, my company decided to setup an internal bare-metal cluster. This cluster should be a platform to earn practice in a cloud-native environment. While there are no plans to run any production workloads soon, we want to enforce different kinds of rules to work as secure as possible from the very beginning.
We are working in multiple cross-functional teams and most developers have never used Kubernetes before. They are familiar with YAML as a configuration language from various projects and tools and have some docker experience.
Requirement analysis
For security, there is no tool that can do everything. So, we have different layers to consider. One of these considerations is Kyverno. With this tool, we can define rules to prevent insecure configurations like hostpath volumes with access to sensitive files. We can also enforce configurations like resource requests and limits for deployments and pods. This helps for manifests but there are still things left. We also want to use third party applications and manifests like Helm charts. So, we must be sure that third parties and our own apps don't misbehave. We want to monitor behavior to have an overview of what is happening in our cluster and be able to react if we detect any bad things. When we have more information, we can investigate how we can prevent it with existing tools like additional Kyverno Policies or additional tooling.
Falco
From many different sources I heard about the open source project Falco. Falco describes itself as the de facto Kubernetes threat detection engine. It uses system calls, kernel events, and additional sources like Kubernetes Audit Events to monitor the runtime behavior of an entire cluster on different levels like sensitive access on nodes or single containers. It uses YAML files to define its detection rules. So, we don't have to learn any additional configuration language. Falco ships with a large set of predefined rules, provided by and maintained by the open source community, which covers a large part of our needs. Beyond our requirement furthermore, it brings support for detecting scenarios like insecure use of configmaps for credentials.
Decisions
It is possible to install Falco as DeamonSet with a provided Helm Chart. The recommended way is to install Falco as kernel module directly on the nodes. As kernel module, it is outside the scope of Kubernetes and it is not possible to disable or remove it with cluster access. We will install it directly on the nodes, so it is not affected by any cluster misbehavior.
We need to configure the cluster to send Kubernetes Audit Events to Falco and be able to monitor both our cluster and the nodes themselves.
Falco provides several output formats to send or persist all found rule violations. Falcosidekick from the Falco ecosystem uses the http_output from Falco to spread the output to many different tools like Loki, Kibana, or Slack. We are using Loki to aggregate our logs and monitor them with Grafana provided by Rancher's Monitoring Stack. So, we will be using Falcosidekick to send Falco rule violations to Loki.
Environment
- Multi Node Cluster hosted on Hetzner Cloud
- Ubuntu 20.04 Operating System
- Bare Metal RKE Cluster managed with Rancher v2.5.5 and Kubernetes v1.19.6
Getting started with Falco
Installing Falco
I follow the official installation instruction for Ubuntu from the Falco Documentation. This must be done on all nodes in the cluster.
Adding the Falco repository:
curl -s https://falco.org/repo/falcosecurity-packages.asc | apt-key add -
echo "deb https://download.falco.org/packages/deb stable main" | tee -a /etc/apt/sources.list.d/falcosecurity.list
apt-get update -y
The next step should be to install the kernel headers for the current kernel version with:
apt-get -y install linux-headers-$(uname -r)
I encountered a problem with this step because for the kernel version on my node Linux 5.4.0-29-generic no linux-headers package existed. I solved it with a kernel upgrade to Linux 5.11.0-051100rc6-generic with the help of this Article: https://sypalo.com/how-to-upgrade-ubuntu.
I upgraded only the Kernel without the Ubuntu part.
If you don't have any issues with installing the linux-headers package, you can skip these steps
Download the kernel files.
cd /tmp

wget -c https://kernel.ubuntu.com/~kernel-ppa/mainline/v5.11-rc7/amd64/linux-headers-5.11.0-051100rc7_5.11.0-051100rc7.202102072330_all.deb
wget -c https://kernel.ubuntu.com/~kernel-ppa/mainline/v5.11-rc7/amd64/linux-headers-5.11.0-051100rc7-generic_5.11.0-051100rc7.202102072330_amd64.deb
wget -c https://kernel.ubuntu.com/~kernel-ppa/mainline/v5.11-rc7/amd64/linux-image-unsigned-5.11.0-051100rc7-generic_5.11.0-051100rc7.202102072330_amd64.deb
wget -c https://kernel.ubuntu.com/~kernel-ppa/mainline/v5.11-rc7/amd64/linux-modules-5.11.0-051100rc7-generic_5.11.0-051100rc7.202102072330_amd64.deb
Install the new kernel version and reboot the node.
sudo dpkg -i *.deb
sudo shutdown -r now
Check if the upgrade succeeded.
uname -rs
Linux 5.11.0-051100rc6-generic
Now I was able to install Falco.
apt-get install -y falco
The last installation step is to start Falco as service.
service falco start
Let's check if it works as expected:
journalctl -fu falco

-- Logs begin at Sat 2021-02-13 08:15:49 CET. --
Feb 13 20:33:09 node-1 falco[19438]: Sat Feb 13 20:33:09 2021: Falco initialized with configuration file /etc/falco/falco.yaml
Feb 13 20:33:09 node-1 falco[19438]: Sat Feb 13 20:33:09 2021: Loading rules from file /etc/falco/falco_rules.yaml:
Feb 13 20:33:09 node-1 falco[19459]: Falco initialized with configuration file /etc/falco/falco.yaml
Feb 13 20:33:09 node-1 falco[19459]: Loading rules from file /etc/falco/falco_rules.yaml:
Feb 13 20:33:09 node-1 falco[19459]: Loading rules from file /etc/falco/falco_rules.local.yaml:
Feb 13 20:33:09 node-1 falco[19438]: Sat Feb 13 20:33:09 2021: Loading rules from file /etc/falco/falco_rules.local.yaml:
Feb 13 20:33:09 node-1 falco[19459]: Loading rules from file /etc/falco/k8s_audit_rules.yaml:
Feb 13 20:33:09 node-1 falco[19438]: Sat Feb 13 20:33:09 2021: Loading rules from file /etc/falco/k8s_audit_rules.yaml:
Feb 13 20:33:10 node-1 systemd[1]: Started LSB: Falco syscall activity monitoring agent.
Feb 13 20:33:10 node-1 falco[19460]: Starting internal webserver, listening on port 8765
Depending on your node it can already track a rule violation like my zsh file access.
Feb 13 20:33:20 node-1 falco[19460]: 20:33:20.106330811: Error File below / or /root opened for writing (user=root user_loginuid=0 command=zsh parent=sshd file=/root/.zsh_history program=zsh container_id=host image=<NA>)
Feb 13 20:33:20 node-1 falco[19460]: 20:33:20.106511423: Warning Shell history had been deleted or renamed (user=root user_loginuid=0 type=unlink command=zsh fd.name=<NA> name=<NA> path=/root/.zsh_history.LOCK oldpath=<NA> host (id=host))
The provided default rules are defined in /etc/falco/falco_rules.yaml. Each rule can be overwritten by creating a rule with the same name in /etc/falco/falco_rules.local.yaml. You can also create you own custom rules in the same file.
Configure RKE to send Kubernetes Audit Events
Falco ships with a set of default rules for Kubernet Audit Events. These rules are located in /etc/falco/k8s_audit_rules.yaml. To use them I have to configure the RKE kube-apiserver container with a corresponding Audit Policy and Webhook configuration. Both files are provided from the Falco evolution repository.
The next steps must be done on all nodes within the cluster.
I created a separate folder on each node and store the configuration files.
mkdir -m 0755 /etc/falco/apiserver
cd /etc/falco/apiserver

curl https://raw.githubusercontent.com/falcosecurity/evolution/master/examples/k8s_audit_config/audit-policy.yaml -o audit-policy.yaml
curl https://raw.githubusercontent.com/falcosecurity/evolution/master/examples/k8s_audit_config/webhook-config.yaml.in -o webhook-config.yaml
Now I have to change the $FALCO_SERVICE_CLUSTERIP in the webhook-config.yaml. Because falco runs on the host OS and the kube-apiserver runs with networkmode host, the container can access the falco webserver on localhost.
apiVersion: v1
kind: Config
clusters:
- name: falco
  cluster:
    server: http://localhost:8765/k8s-audit
contexts:
- context:
    cluster: falco
    user: ""
  name: default-context
current-context: default-context
preferences: {}
users: []
The kube-apiserver can be configured by updating the RKE cluster.yaml. If the RKE cluster was created with the rke CLI tool the file is on your local machine. I created this cluster with Rancher, so I can update the cluster.yaml in the Rancher Cluster Manager UI. Select your cluster and click on Edit in the Menu. Click on Edit as YAML to update your kube-apiserver.
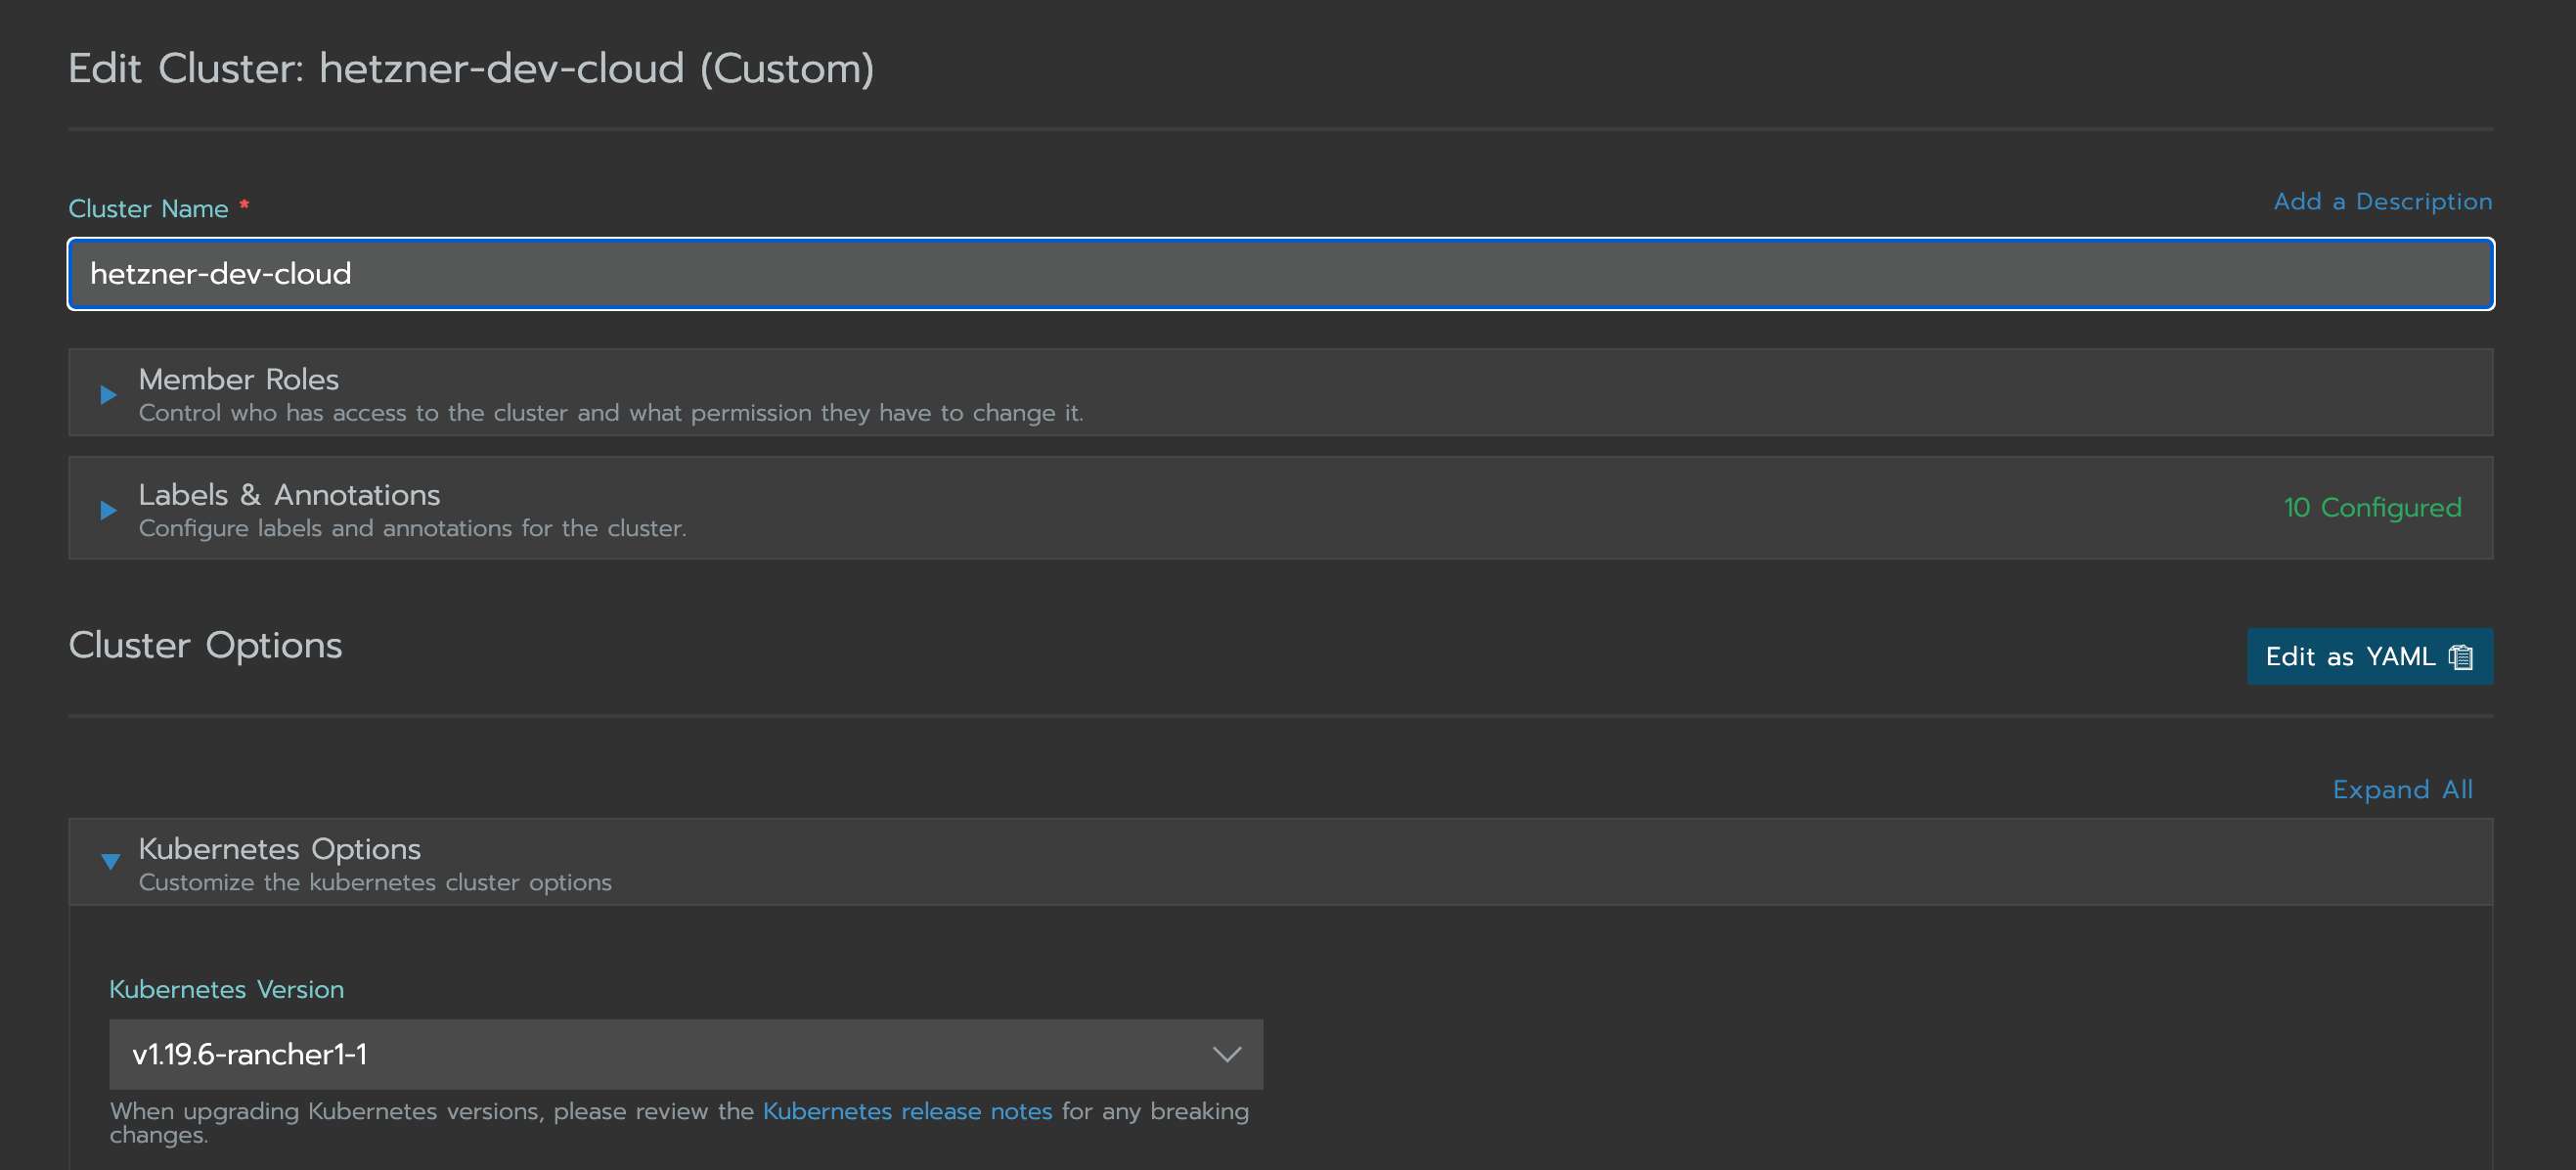
Update the kube-apiserver configuration in a RKE CLI based cluster.yaml under services.kube-api, for a cluster.yaml created by Rancher under rancher_kubernetes_engine_config.services.kube-api. I mount the falco configuration files with the extra_binds property into the kube-apiserver and add them as extra_args to the API Server.
# cluster.yaml created by Rancher
# this snipped includes only the changeset

rancher_kubernetes_engine_config:
  services:
    kube-api:
      # This WILL OVERRIDE any existing defaults
      extra_args:
        audit-policy-file: /etc/falco/audit-policy.yaml
        audit-webhook-config-file: /etc/falco/webhook-config.yaml
        delete-collection-workers: '3' # prevent changes to already existing default value
      extra_binds:
        - '/etc/falco/apiserver:/etc/falco'
Save the cluster.yaml in the Rancher UI or use rke up, depending on your cluster. The changes will be applied and the kube-apiserver should be started successfully.
Try it out
To be sure the Kubernetes Audit Events are sent to Falco, I will trigger one of the Falco Kubernetes rules. I create a ConfigMap with an aws_access_key_id key which triggers the Create/Modify Configmap With Private Credentials rule.
kubectl create configmap credentials --from-literal aws_access_key_id=super-secret
On only one of the cluster master nodes should be a new entry.
Feb 13 23:08:49 node-1 falco[539986]: 23:08:49.288822016: Warning K8s configmap with private credential (user=system:serviceaccount:cattle-system:kontainer-engine verb=create configmap=credentials config={\"aws_access_key_id\":\"super-secret\"})
First Result
Falco is installed and running on all cluster nodes. The provided configuration and rules are in place and it created its first alerts based on them. On top of that RKE is configured to send Kubernetes Audit Events. This additional event source gives Falco the possibility to monitor the whole cluster and its workloads.
Centralize Falco Alerts with Falcosidekick
While Falco is up and running on all nodes there is no central place for an overview of all rule violations. Because Falco is installed on the host there is no access point within the cluster. To solve this problem I will use Falcosidekick. Each Falco service will send its alerts to a centralized Falcosidekick application which will provide different targets to monitor them.
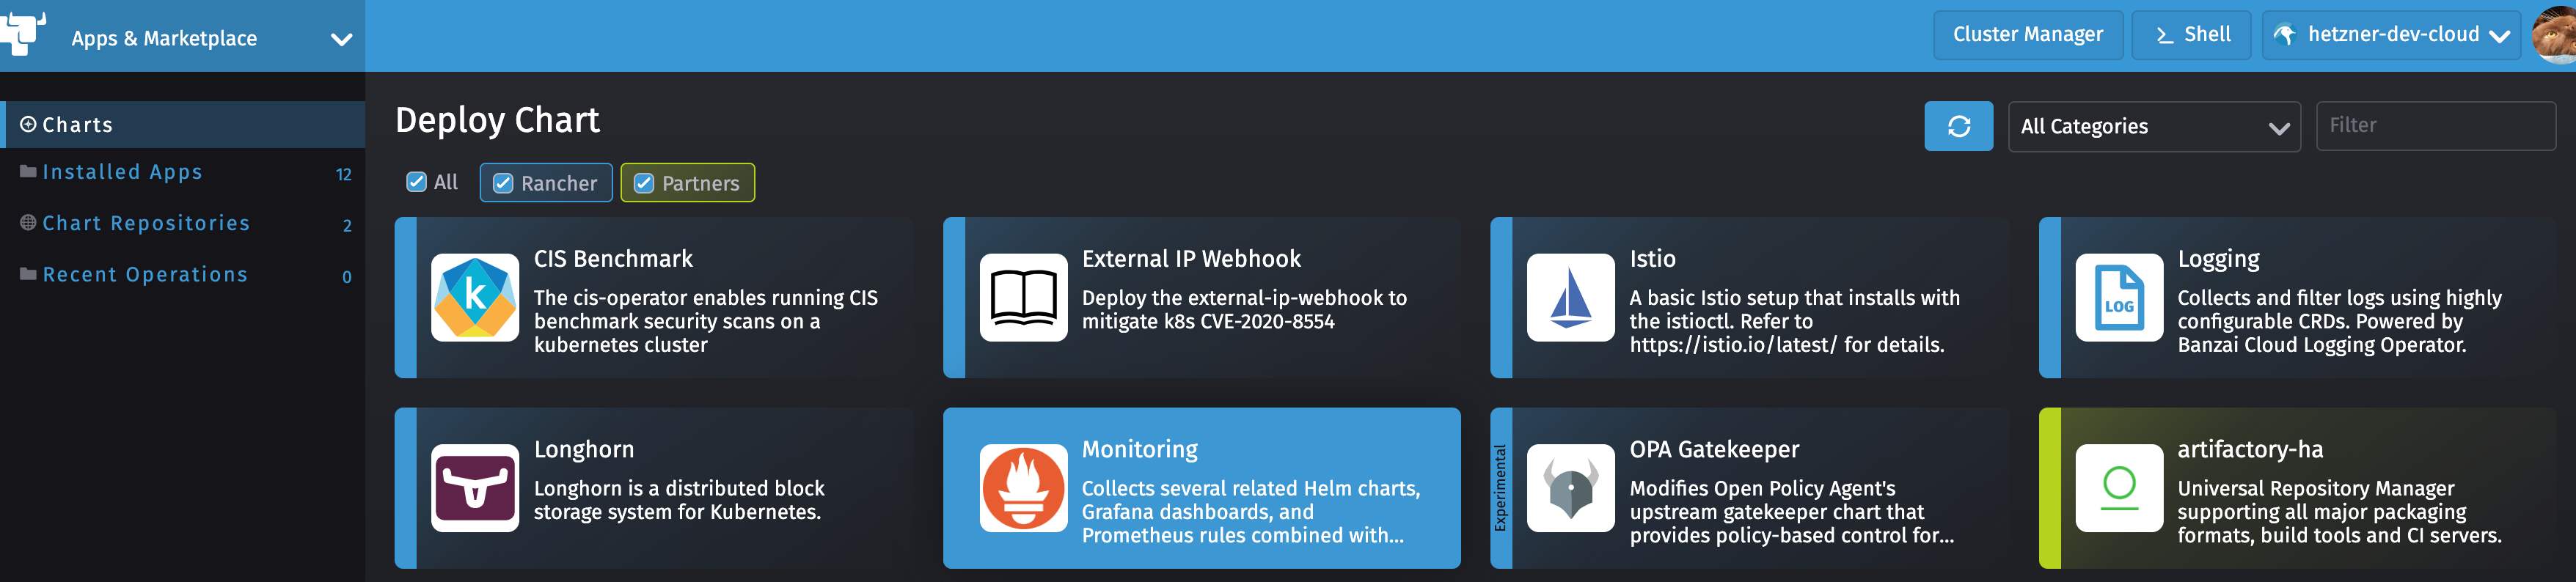
I'm using the provided Helm Chart from the Falco community to install it. As workload in the cluster, I can send the alerts to the internal cluster Monitoring.
helm repo add falcosecurity https://falcosecurity.github.io/charts
helm repo update
I install Falcosidekick with the new Falcosidekick UI. This UI provides a simple way to verify if my configuration works.
helm install falcosidekick falcosecurity/falcosidekick --set webui.enabled=true --namespace falcosidekick --create-namespace
Check if Falcosidekick and Falcosidekick UI are up and running.
kubectl get pod,service -n falcosidekick

NAME                                   READY   STATUS    RESTARTS   AGE
pod/falcosidekick-5f44cb5bff-s974v     1/1     Running   0          39s
pod/falcosidekick-5f44cb5bff-z8jmz     1/1     Running   0          39s
pod/falcosidekick-ui-867f5d6f7-26hp6   1/1     Running   0          39s

NAME                       TYPE        CLUSTER-IP      EXTERNAL-IP   PORT(S)    AGE
service/falcosidekick      ClusterIP   10.43.103.143   <none>        2801/TCP   39s
service/falcosidekick-ui   ClusterIP   10.43.129.135   <none>        2802/TCP   39s
The next step is to configure the Falco service on all nodes to send its alerts to Falcosidekick. So, I connect on each node and update the configuration file /etc/falco/falco.yaml to send the alerts in JSON format over HTTP to the given ClusterIP.
# /etc/falco/falco.yaml
# this snipped includes only the changeset

json_output: true
json_include_output_property: true
http_output:
  enabled: true
  url: "http://10.43.103.143:2801/" # use your ClusterIP for falcosidekick instead
After updating the Falco configuration, you have to restart the service service falco restart.
Let's use the Falcosidekick UI which I installed together with Falcosidekick.
kubectl port-forward service/falcosidekick-ui 2802:2802
I already see notice events because kubectl port-forward triggers a Falco rule.

Second Result
The first step was to install and configure Falco as well as the cluster. But there was no easy way to see if it worked and I have to check the alerts on each node. With the integration of Falcosidekick and the new Falcosidekick UI, I have a centralized place to view the alerts and verify that everything is working as expected.
Monitoring with Loki and Grafana
The Falcosidekick UI is a good starting point but not suitable for long time Monitoring and custom evaluations.
I will use Loki because I'm already using it as a log aggregator for my workloads. It is not part of the default Monitoring Stack from Rancher, so I had to install it on my own.
Requirements
- Rancher v2.5 or above to use the new Monitoring Stack
- Rancher Monitoring is installed and working
Installing Loki
Loki is available as Helm Chart. There are multiple Options you can choose from. In the scope of this article Loki as standalone service is enough. I am using the Loki Stack to install Loki together with Promtail. Promtail is a tool which will send the logs from all my workloads to Loki. So, Loki becomes my general log aggregation solution for my cluster.
helm repo add grafana https://grafana.github.io/helm-charts
helm repo update
Loki and Promtail are enabled by default in this chart. I don't install any other optional application from it.
helm install loki grafana/loki-stack --namespace=loki-stack --create-namespace
Let's check if it was installed successfully.
kubectl get pods,services -n loki-stack

NAME                  READY   STATUS    RESTARTS   AGE
loki-0                1/1     Running   0          1m43s
loki-promtail-ldf2n   1/1     Running   0          1m43s
loki-promtail-lx2s6   1/1     Running   0          1m43s
loki-promtail-skm8m   1/1     Running   0          1m43s

NAME            TYPE        CLUSTER-IP    EXTERNAL-IP   PORT(S)    AGE
loki            ClusterIP   10.43.84.52   <none>        3100/TCP   1m43s
loki-headless   ClusterIP   None          <none>        3100/TCP   1m43s
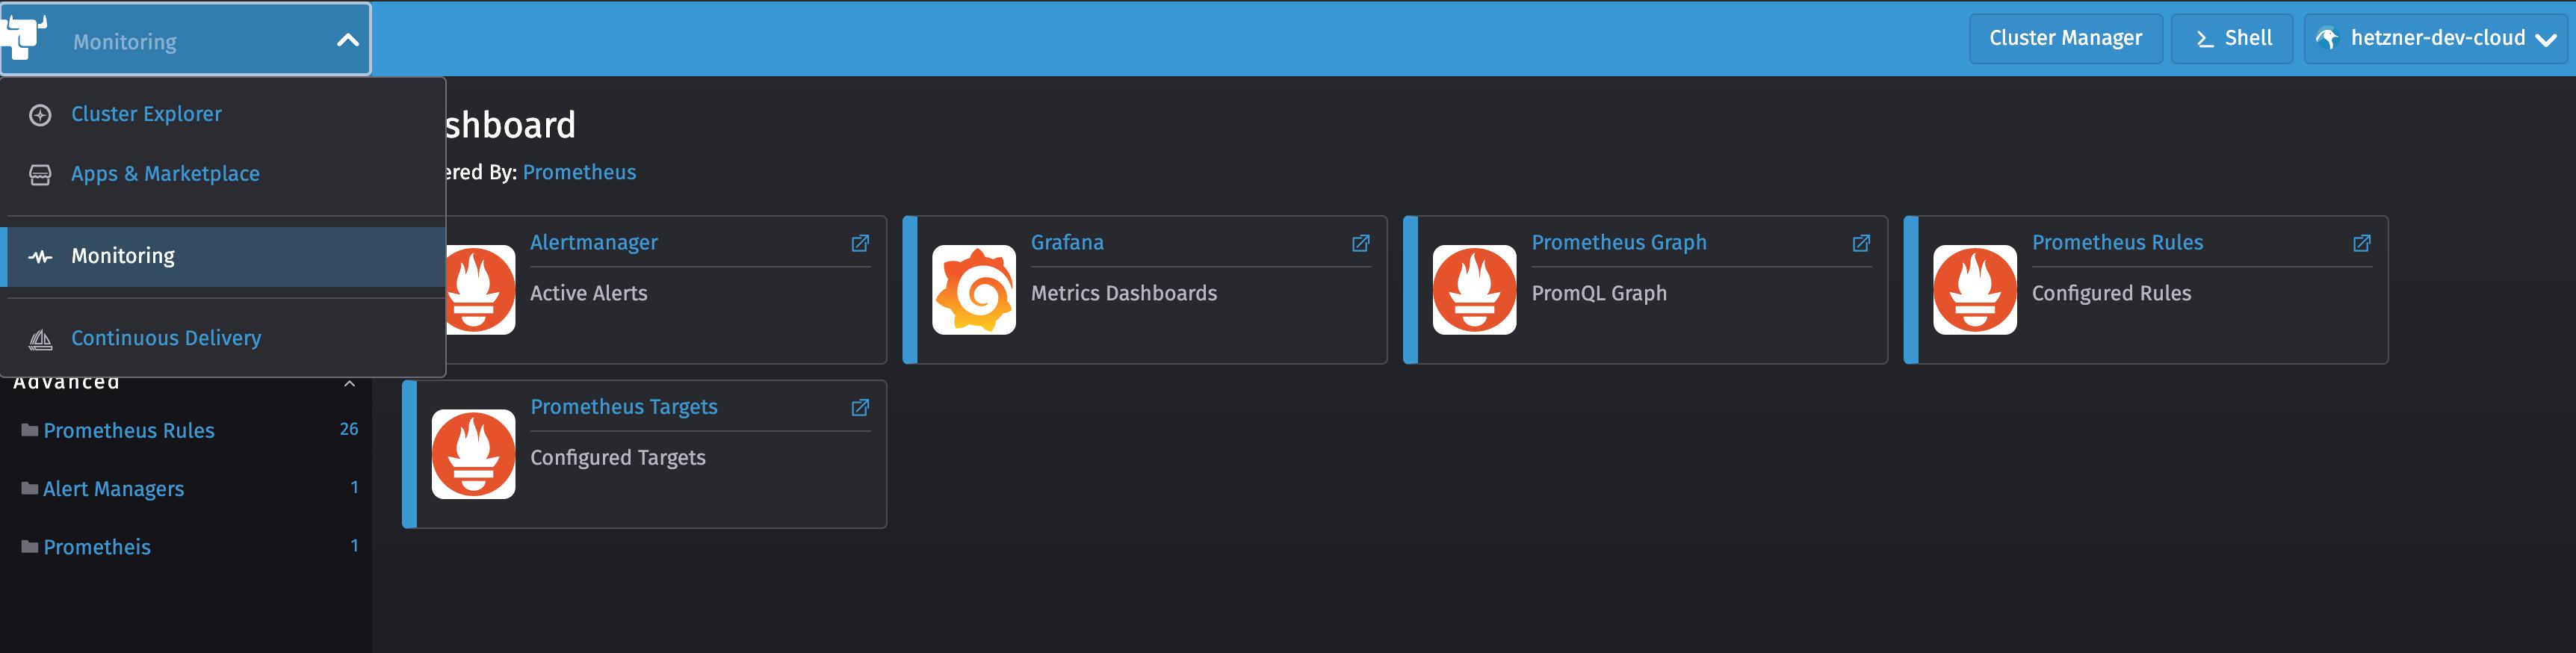
To use Loki in the provided Grafana from the Monitoring Stack, I must add Loki as additional data source.
You have to be authenticated and have the required Admin role in Grafana.
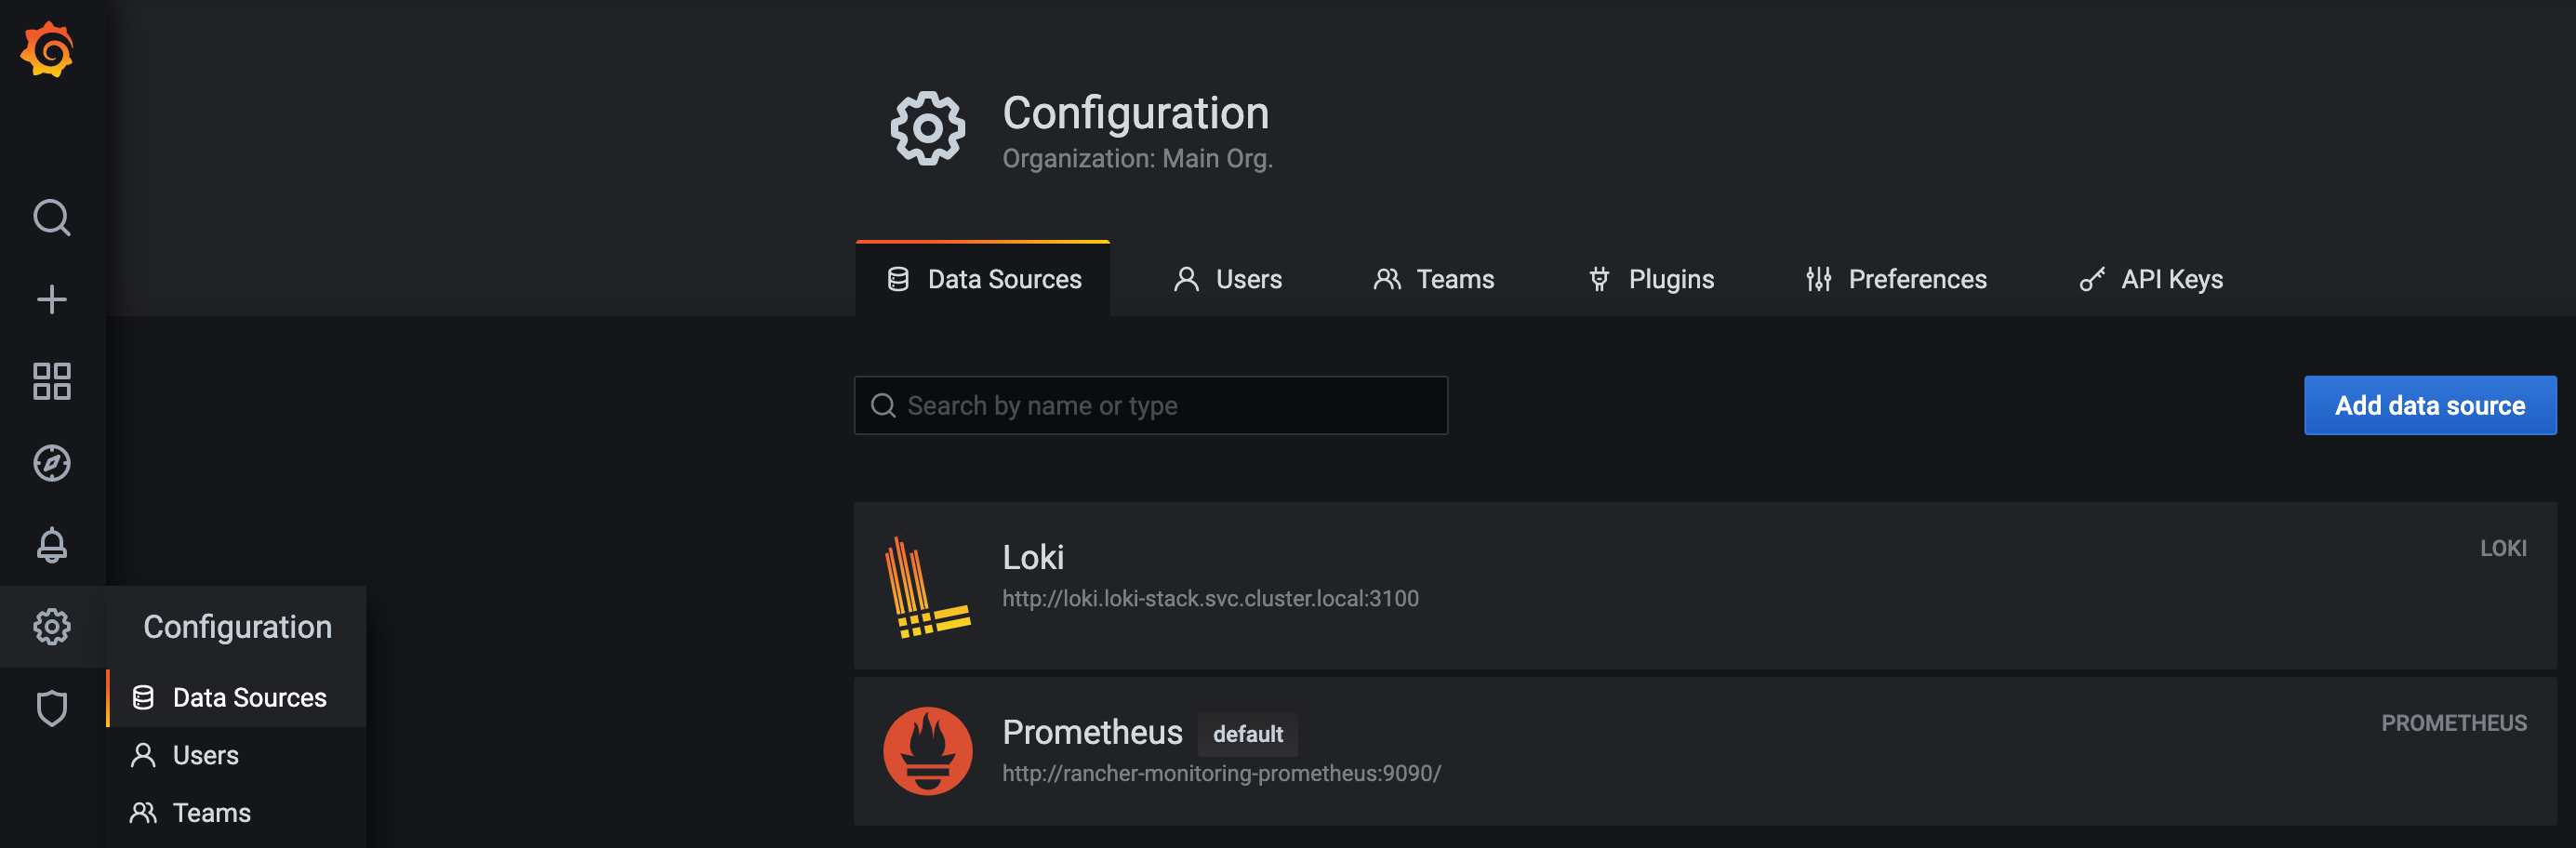
Click "Add data source" and select "Loki" under "Logging & document databases".
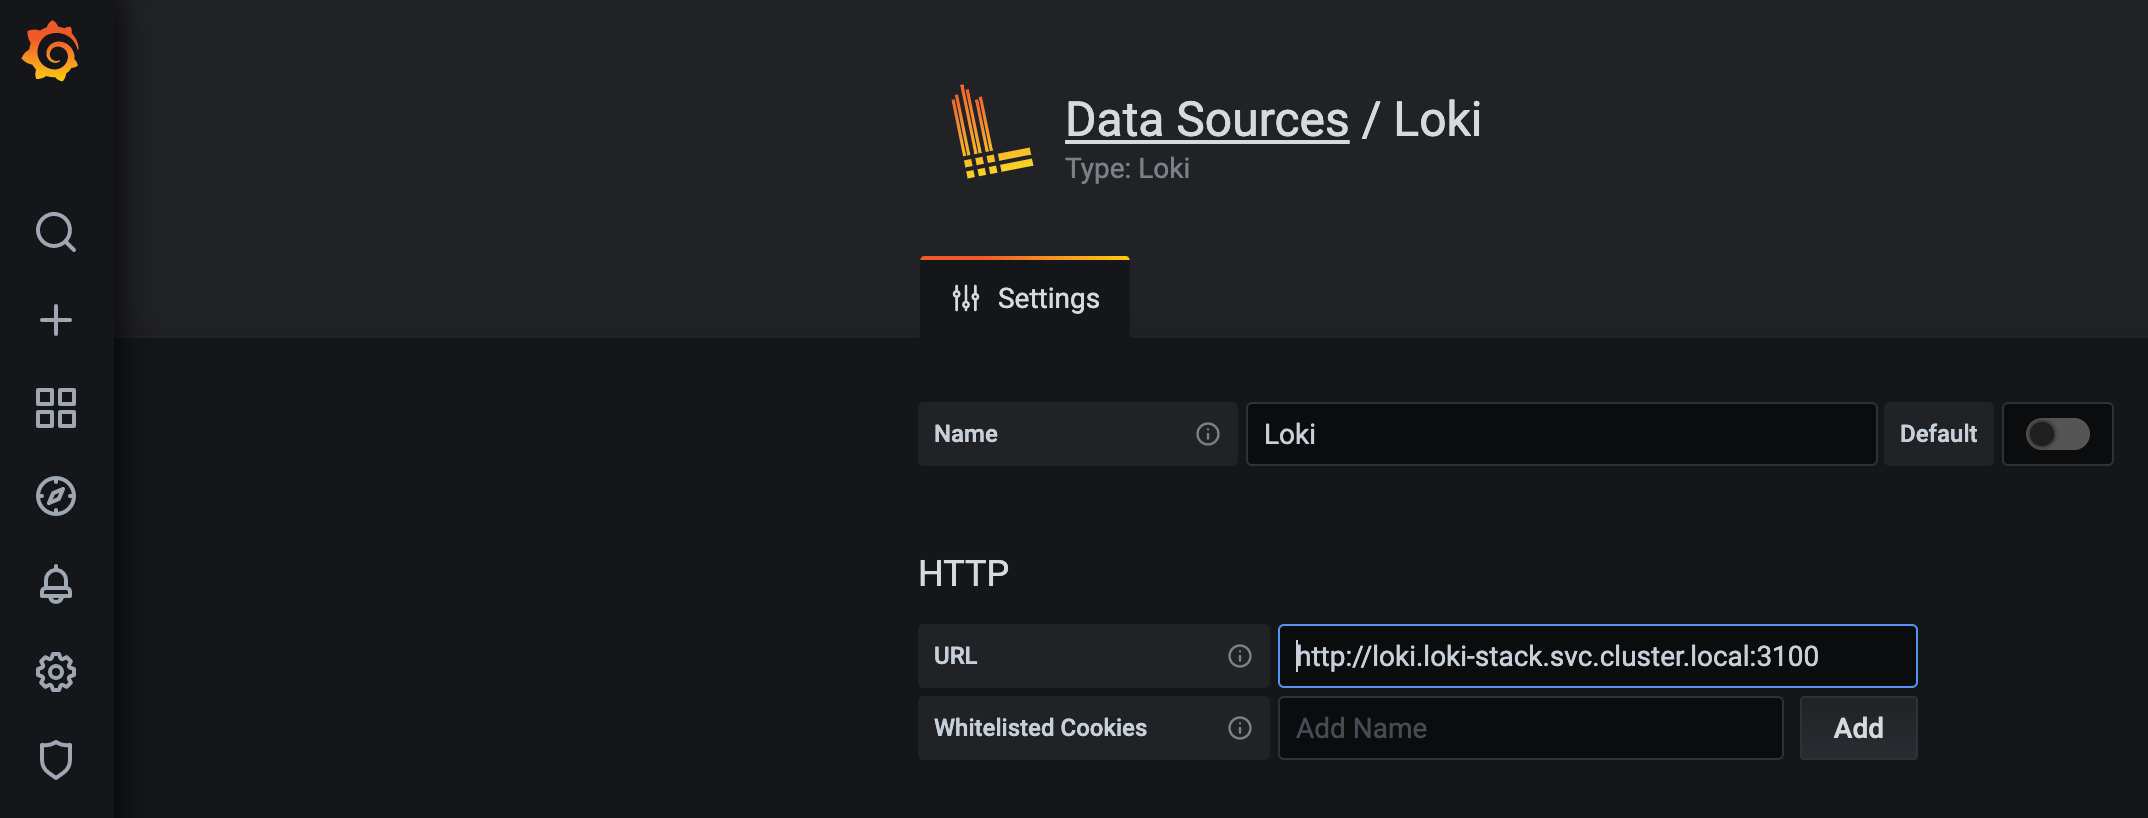
Now I must configure Loki by setting the URL to my Loki service. Because it is running in a separate namespace, I have to use the full qualified service URL http://loki.loki-stack.svc.cluster.local:3100. I don't configure anything else. It is not accessible from the outside world and so I have no additional authentication configured.
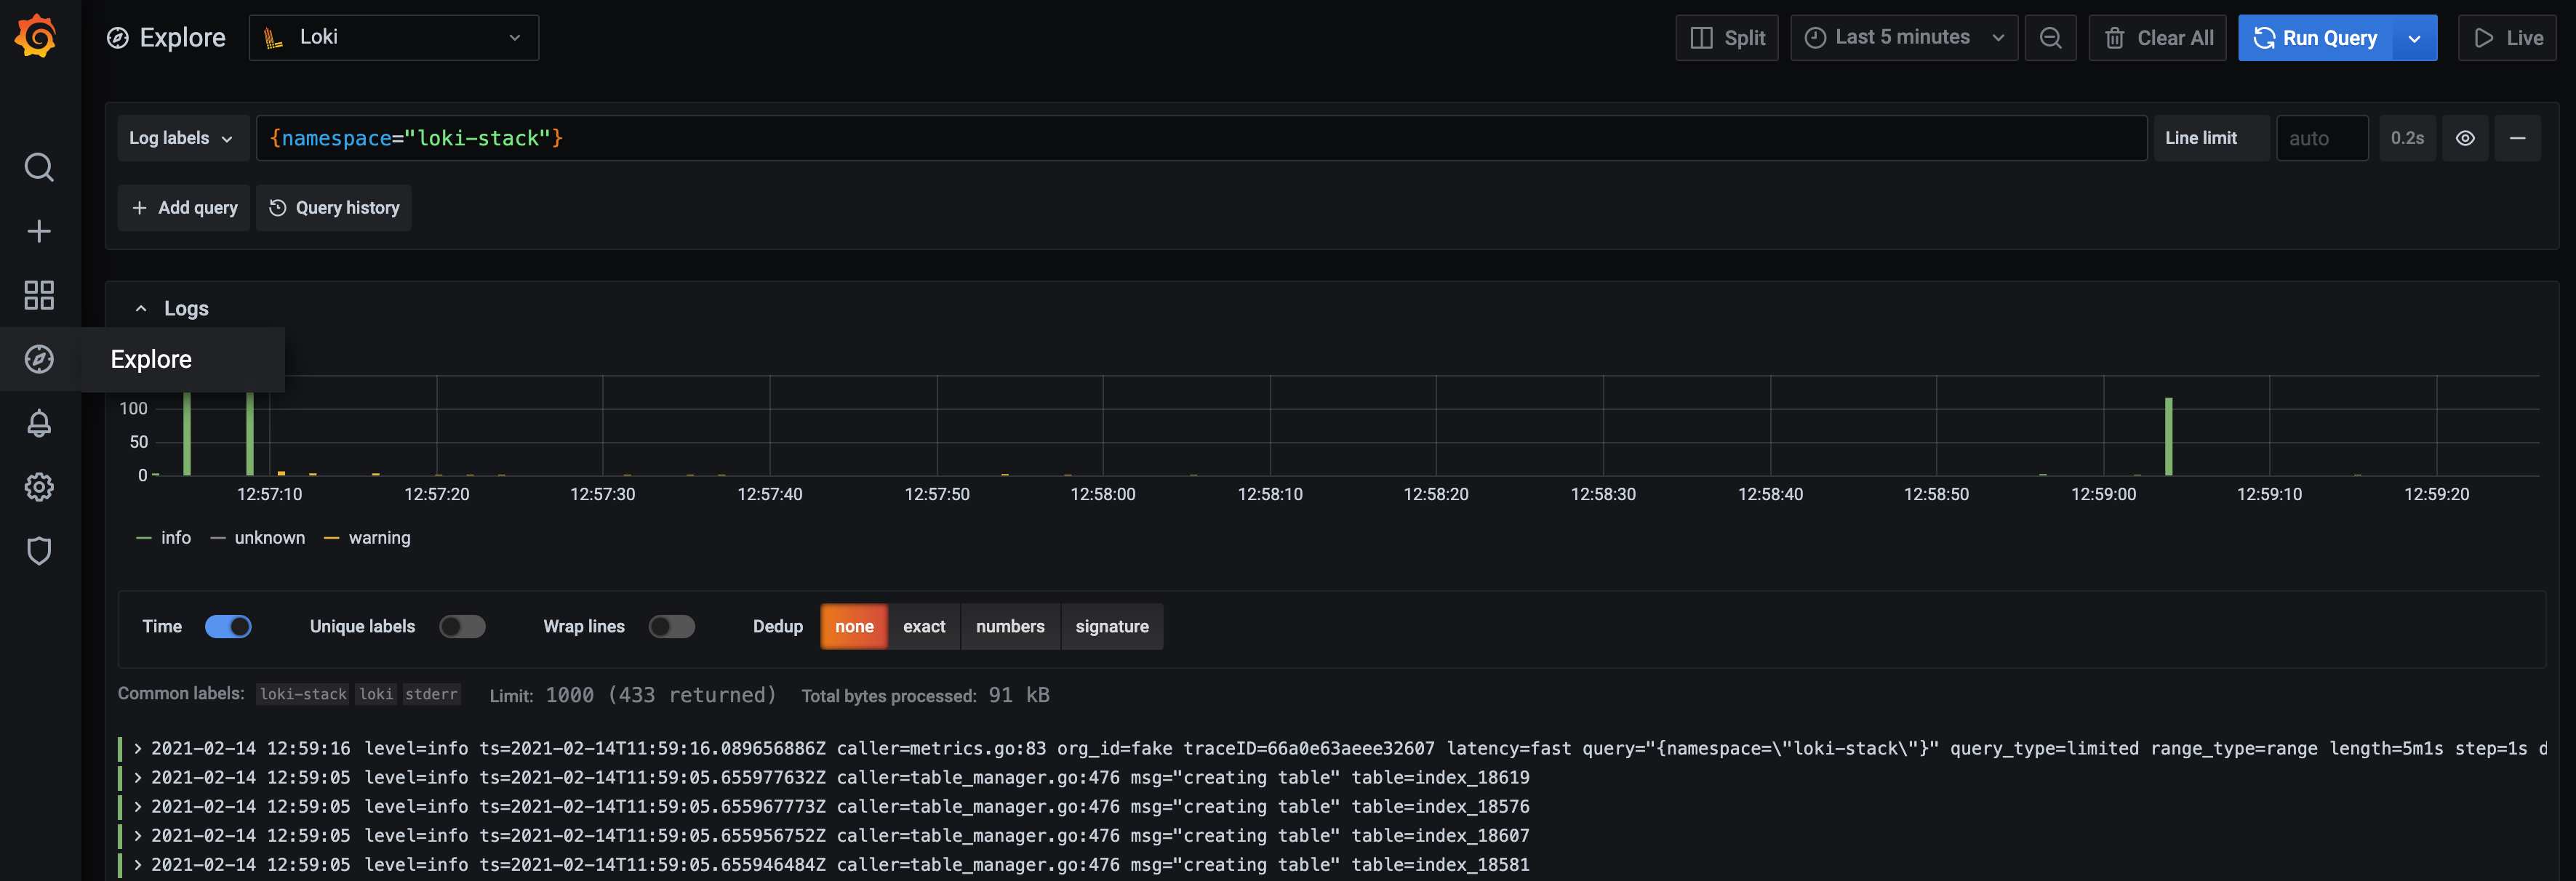
I can verify that it is working by using the Grafana Explore View to search for logs from Loki itself. It's possible that this only works when the loki-stack was installed.
To configure Falcosidekick to use Loki as a output target, I add additional values to the Falcosidekick Helm installation.
helm upgrade falcosidekick falcosecurity/falcosidekick --set config.loki.hostport=http://loki.loki-stack.svc.cluster.local:3100 --set config.customfields="source:falco" --set webui.enabled=true --namespace falcosidekick
I updated the Loki hostport configuration to the Loki service inside of the cluster. I also added a custom field to be able to query all logs from Falco in Grafana.
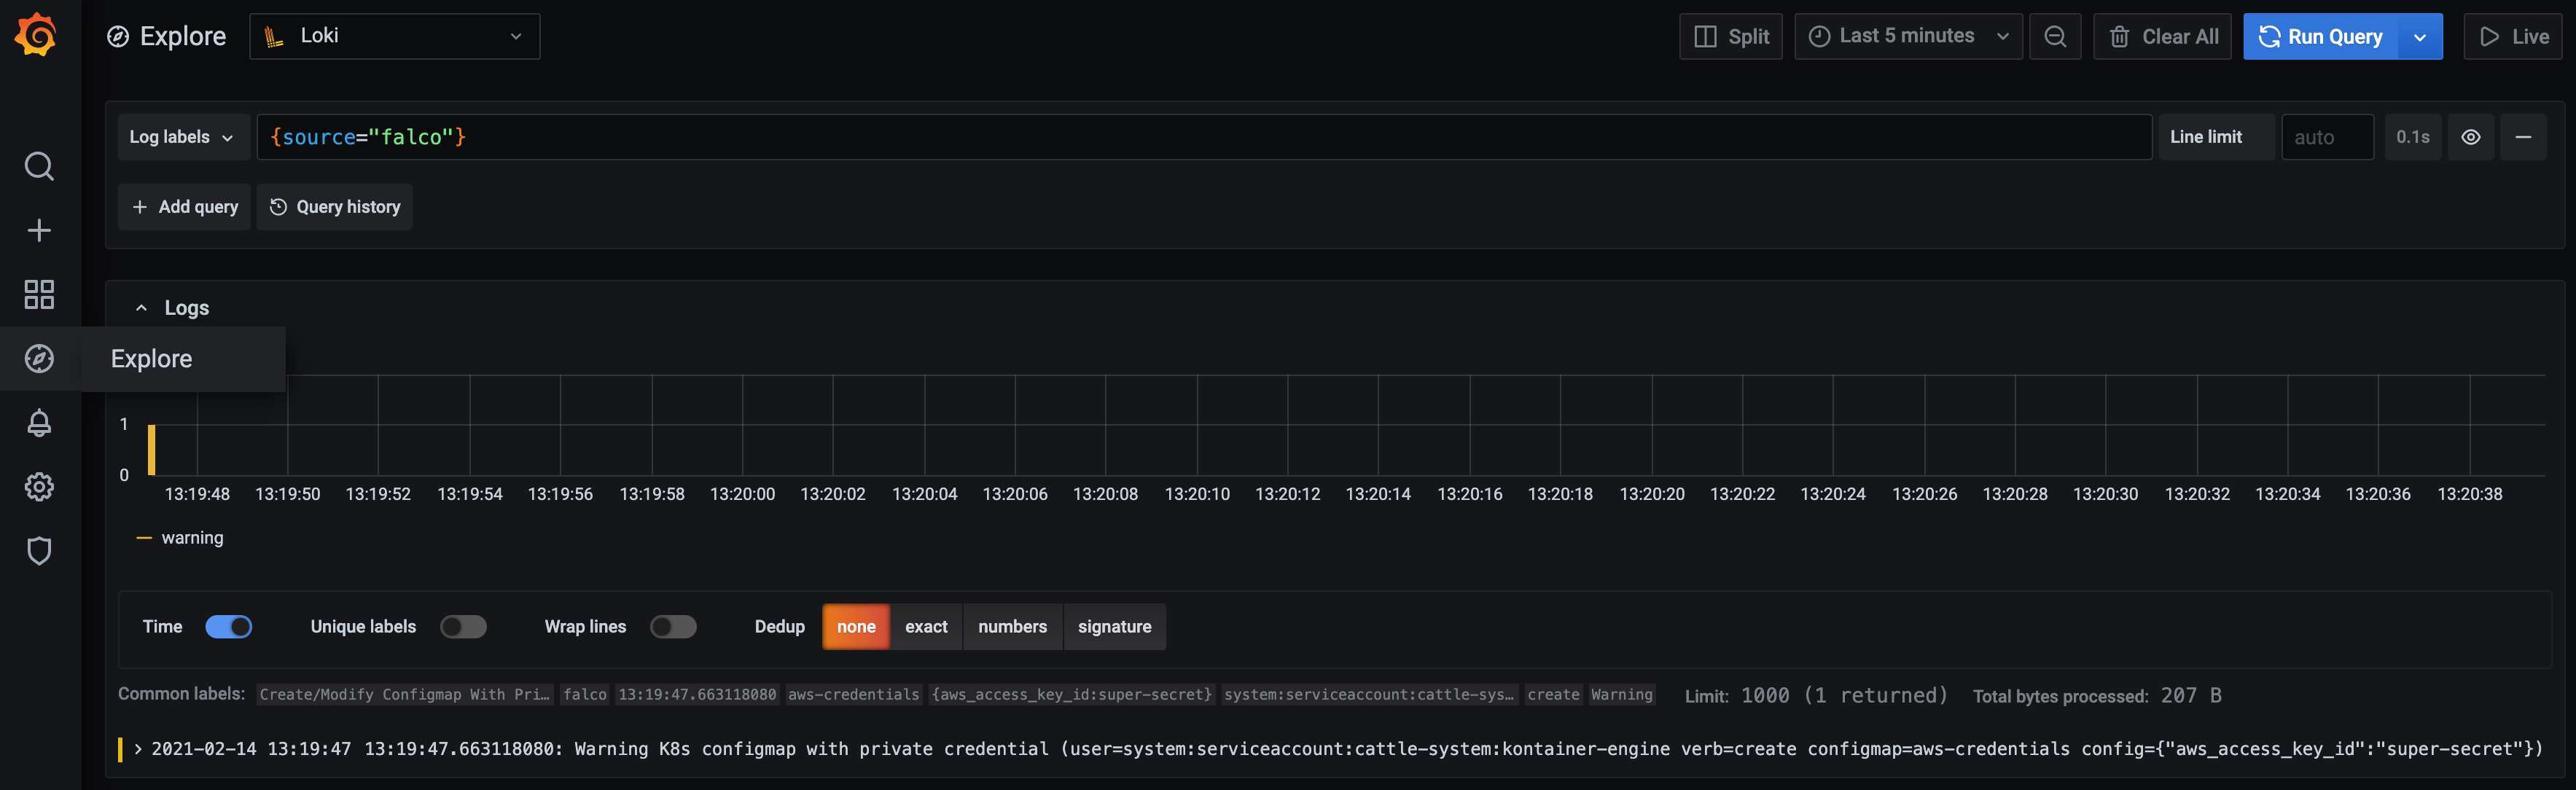
To verify that the configuration works, I will trigger Falco by reusing the example with an aws_access_key_id key in a ConfigMap.
kubectl create configmap aws-credentials --from-literal aws_access_key_id=super-secret
I'm using the custom field to query all Falco alerts within Grafana.
Conclusion
It takes several steps to get everything up and running but we get a big security and monitoring improvement too. We can monitor how our, as well as third party applications behave at runtime and if they do any unexpected bad action. We can improve our security over time by adding our own custom rules or change existing rules to our needs. With Falcosidekick we are flexible enough to add more additional channels to get early feedback for special kinds of alerts. With Loki and Grafana we can create Dashboards to have a much better overview. As a little cherry on the cake, we not only enabled Falco alerts for Grafana, with Loki and Promtail together we installed a general logging solution for all our cluster workloads.
If you have any feedback feel free to contact me on Twitter @FrankJogeleit.
This article was published on CodeYourWorld.
Special Thanks to the Falco Community
While I did my first steps with Falco, I encountered a few small problems. To solve these issues, I joined the falco community in the official Kubernetes Slack Workspace and they helped me a lot. I fixed a documentation issue. The Maintainer and I found and fixed a bug in Falcosidekick which causes problems when sending Kubernetes Audit Events to Loki and we finalized the first version of the Falcosidekick UI. At the end of my experiment, I not only have a running runtime monitoring, but I'm also an official contributor to the Falcosidekick- and Falcosidekick UI Project.
Get involved
If you would like to find out more about Falco:
- Get started in Falco.org.
- Check out the Falco project on GitHub.
- Get involved Falco community.
- Meet the maintainers on the Falco Slack.
- Follow @falco_org on Twitter.
